
Learn
Tutorials for scientific graphs and statistics
Each tutorial covers one task with step-by-step instructions and screenshots. Tutorials with sample data open straight in the editor, so you can repeat the steps on the same data.
12 tutorials
Make a graph
Build the graph your figure needs, from data entry to a finished plot.
-
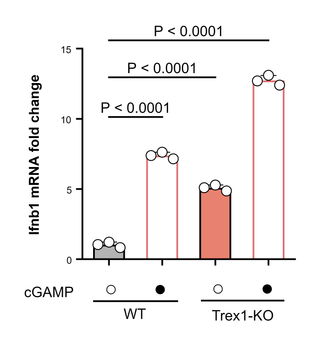
How to make a bar graph with error bars (SD, SEM or 95% CI)
Make a bar graph with mean ± SD, SEM or 95% CI error bars, show the individual data points, and export it at 300 or 600 dpi for a journal.
-
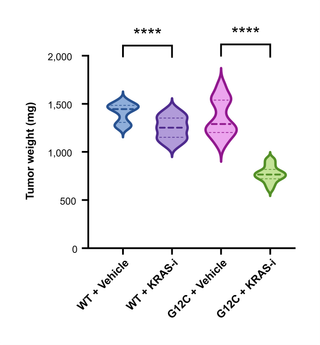
How to add significance stars to a graph (t-test or ANOVA)
Add significance brackets with stars (*, **, ***, ****) or ns to a bar, box, violin or dot plot from a t-test, Mann–Whitney test or one-way ANOVA.
-
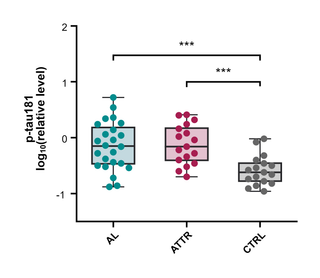
How to make a box plot (box and whisker plot)
Make a box and whisker plot from raw data, choose Tukey, min-to-max or percentile whiskers, and read the median, quartiles and outliers.
-
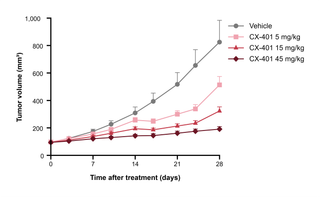
How to make a line graph with error bars (mean ± SEM over time)
Plot repeated measurements over time, such as tumor growth curves, as a line graph with mean ± SD or SEM error bars from replicate values.
-
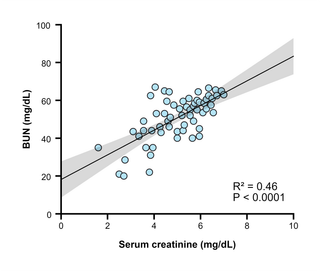
How to make a scatter plot with a regression line and R²
Make an XY scatter plot, fit a linear regression line with a 95% confidence band, and read the slope, intercept, R² and P value.
-
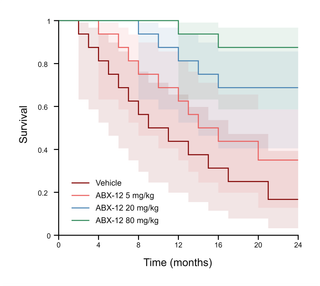
How to make a Kaplan–Meier survival curve and run a log-rank test
Enter survival times with event and censoring codes, draw Kaplan–Meier curves, and compare groups with the log-rank test, median survival and hazard ratio.
Statistics
Choose the right test, run it, and read the results.
-
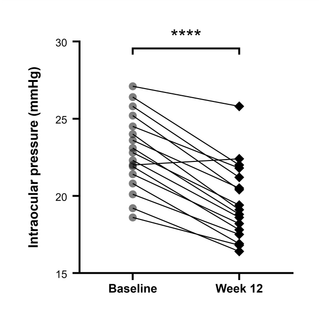
How to do a t-test: unpaired, paired and Mann–Whitney
Compare two groups with an unpaired or paired t-test (or Mann–Whitney or Wilcoxon), read the P value, 95% CI and effect size, and report the result.
-
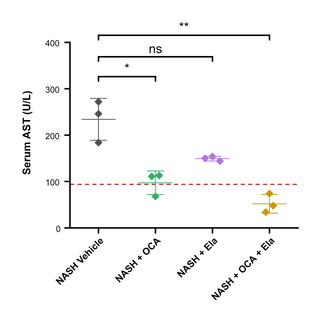
How to run a one-way ANOVA with Tukey or Dunnett multiple comparisons
Run a one-way ANOVA on three or more groups, choose Tukey, Dunnett or Šídák multiple comparisons, read the results, and add significance brackets.
-
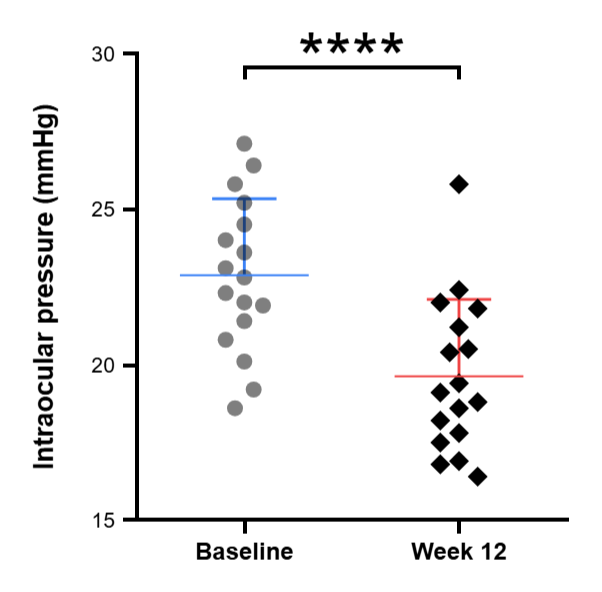
SD vs SEM: which error bars should a figure show?
What SD, SEM and 95% CI error bars mean, how they are calculated, which one to use in a figure, and how to switch between them in PivoGraph.
-
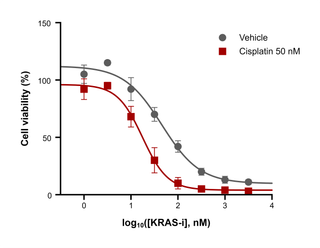
How to calculate IC50 or EC50 from a dose–response curve (4PL fit)
Fit a four-parameter logistic (4PL) dose–response curve, read the IC50 or EC50, Hill slope, top and bottom, and draw the fitted curve on the graph.
Prepare for journals
Export figures that meet journal submission requirements.
-
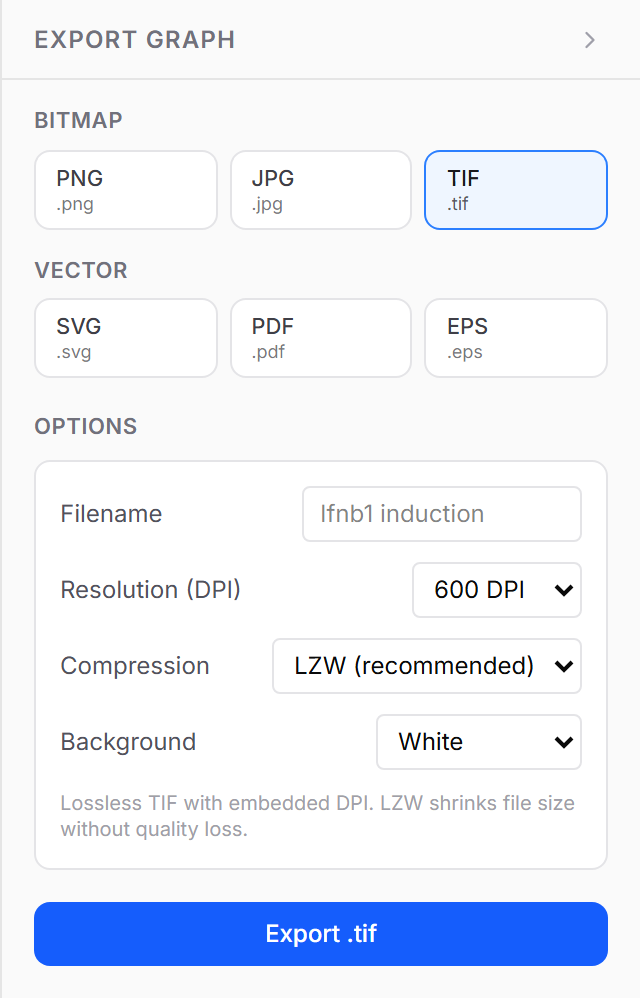
How to export a 300 dpi TIFF figure for a journal (or PDF and EPS)
Export a graph as a TIFF at 300, 600 or 1200 dpi with lossless LZW compression, or as vector PDF, EPS or SVG, to meet journal figure requirements.
Using PivoGraph
Data tables, projects, and the everyday workflow.
-
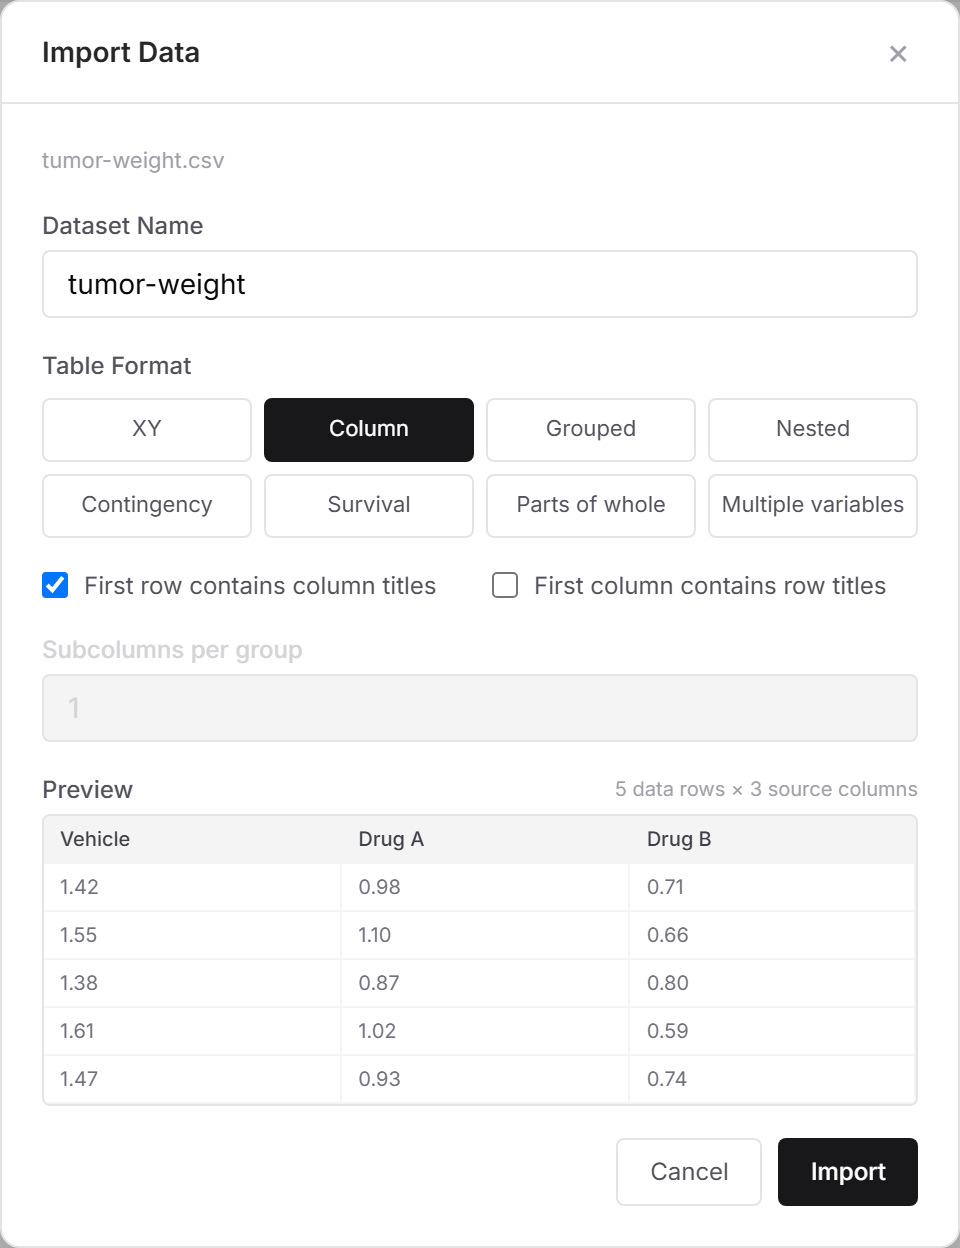
How to import data from Excel (CSV) into PivoGraph
Save an Excel sheet as CSV UTF-8, import it with File → Import Data (CSV), choose the table format and column titles, and check the preview.
Supported graph types
See what data each graph needs and what you can adjust, then start from an example template. See more graph types in the example gallery.
-
Violin plot maker
Make a violin plot from raw data in your browser, with median and quartile lines, optional data points, t-test or ANOVA stars, and 1200 dpi TIFF or PDF export.
-
Box plot maker
Make a box and whisker plot from raw data: Tukey, min-to-max or percentile whiskers, every data point on top, significance stars and journal-ready export.
-
Bar graph maker with error bars
Make a bar graph with error bars from raw replicates: mean ± SD, SEM or 95% CI, every data point on the bars, t-test or ANOVA stars, and 1200 dpi TIFF export.
-
Kaplan–Meier survival curve maker
Draw Kaplan–Meier curves from 1/0 event codes, show the number at risk, compare groups with the log-rank test, and get median survival and hazard ratios.
-
Dose–response curve maker
Fit a four-parameter logistic dose–response curve, read the IC50 or EC50, Hill slope and R², and draw the fitted curves on a log concentration axis.