Free for the whole lab
No subscriptions, seat limits or trial expiry. High-resolution exports have no watermark, so students, new lab members and collaborators can all use the same tool.
PivoGraph vs GraphPad Prism
PivoGraph preserves the table-first workflow scientists rely on: eight familiar data table types, analyses connected to your data, direct graph editing and journal-ready exports. It is free, runs in a browser with nothing to install, and performs every calculation on your device.
Both organize scientific work around structured data tables that connect to analyses and graphs. The key differences are how quickly you can start, where you can work and what it costs.
| PivoGraph | GraphPad Prism | |
|---|---|---|
| Price | FreeNo subscription, trial period or export watermark. | Annual subscriptionUS$260 per user per year for academic users; commercial plans cost more.1 |
| Getting started | Open it in your browserNo download, account or license key. | Install and activateDownload the desktop application, then activate a license.2 |
| Where it runs | Modern desktop browsersWorks on Windows, macOS, Linux and ChromeOS. | Windows and macOS64-bit Windows 10 or 11, or macOS 12 or later.2 |
| License checks | No license checksNothing to renew or re-verify. | Periodic online checkThe license is verified online at least every 30 days or 20 launches.2 |
| Your research data | Stays on your deviceProcessed in your browser and saved to your own disk; never uploaded to PivoGraph. | Stored locally by defaultPrism Cloud is available for optional sharing.3 |
| Data tables | Eight familiar table typesXY, Column, Grouped, Nested, Contingency, Survival, Parts of whole and Multiple variables. | Eight table typesXY, Column, Grouped, Nested, Contingency, Survival, Parts of whole and Multiple variables.4 |
| Publication export | Up to 1200 dpi, plus vectorPNG, JPG and TIFF from 300 to 1200 dpi; SVG, PDF and EPS. | Up to 1200 dpi, plus vectorTIFF at 100–1200 dpi; PDF, EPS and SVG as vector formats.5 |
| Visual editing | Live canvas feedbackDrag appearance sliders and watch the canvas update continuously—no separate Apply step. | Dialog and Apply workflowChoose options in the Format Graph dialog, then click Apply to see the effect.6 |
| Sharing with collaborators | Send one fileAnyone can open and edit a .pivograph project free in their browser. |
Viewing is free; editing needs a seatFree Prism Cloud accounts can view, comment on and download shared projects; publishing edits requires a subscription.3 |
GraphPad Prism details are from GraphPad’s own website and user guide, checked on 3 October 2026. Prices are US list prices before tax. See sources.
A direct path from replicate data to a submission-ready figure, without licenses to manage or desktop software to maintain.
No subscriptions, seat limits or trial expiry. High-resolution exports have no watermark, so students, new lab members and collaborators can all use the same tool.
Nothing to install and no administrator access required. Work on a lab PC, a shared workstation, a Linux machine, a Chromebook or your own laptop.
Tables, statistics and figures are processed inside your browser tab, and projects are saved to your own disk. Unpublished results never leave your device.
Choose a table type, enter replicates, then build the graph and analysis from the same data. Populate significance brackets from t-test results, and edit axes, legends and labels directly on the canvas.
Export PNG, JPG and TIFF from 300 to 1200 dpi, or use vector SVG, PDF and EPS so axes, symbols and text stay sharp at print size.
A .pivograph project is plain JSON with a published specification and JSON Schema. Scripts and AI assistants can draft a project from your data for you to open, check and refine.
Statistics you can check. Every method is documented publicly, including definitions, scope and checks against published values and independent implementations.
See validationFamiliar table types and direct paste or CSV import make it easy to move an existing data set.
Create a Column, XY, Grouped or other table to match the structure of your experiment.
Copy the data table from your spreadsheet or existing project and paste it in, or import a CSV file.
Choose a graph, run the analysis, refine it on the canvas and export at the resolution your journal requires.
Every example opens in PivoGraph with its data, analyses and styling intact. Replace the values with your own, refine the figure and export.
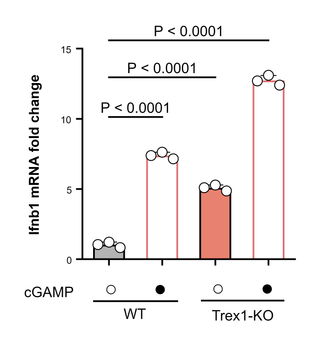
Mean ± SD with P values
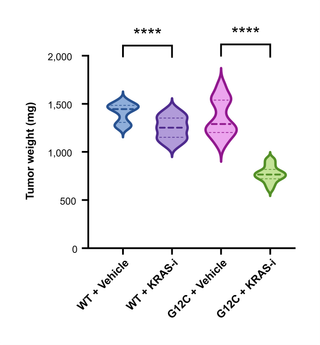
Welch t-tests, median and quartiles
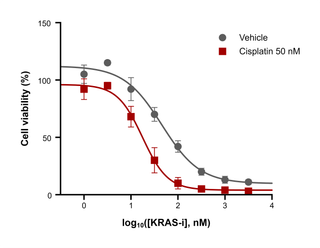
Nonlinear regression on log concentration
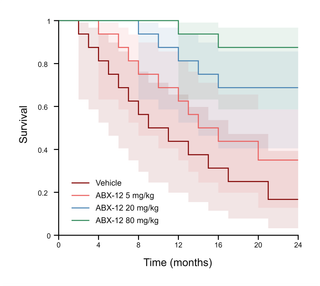
95% confidence bands
Common questions from researchers moving their figures to PivoGraph.
Yes. Data tables, analyses, graph editing and exports up to 1200 dpi are free to use. No account is required, there is no trial period, and exported figures have no watermark.
No. Tables, analyses and figures are processed inside your browser tab, and you save project files to your own disk. Research data is never uploaded to PivoGraph, so unpublished results stay on your device.
Yes. PivoGraph does not open .prism or .pzfx project files directly, but you can copy values from the original data table, or save them as CSV, then paste or import them into the corresponding PivoGraph table. The familiar table types make it straightforward to choose the right destination.
Descriptive statistics; unpaired Welch, unpaired Student and paired t-tests, with significance brackets populated from the results; row-by-row t-tests on Grouped tables; linear regression; four-parameter logistic dose–response fits; Kaplan–Meier curves with log-rank and Gehan–Breslow–Wilcoxon comparisons and hazard ratios; frequency distributions; and Pearson or Spearman correlation matrices. The validation page documents each method, its definitions and its reference checks.
Yes. PivoGraph runs in a modern desktop browser on Windows, macOS, Linux and ChromeOS, including shared lab computers where you cannot install software.
Save the project as a .pivograph file and send it. Your collaborator can open it in PivoGraph and edit it immediately in their browser, free and without an account or license.
Cite the PivoGraph version you used, the project URL and your access date, for example: PivoGraph, version X.Y. https://pivograph.com/ (accessed YYYY-MM-DD).
Open the editor and paste your data, or start from an example that already looks the way you want.
GraphPad and Prism are third-party trademarks and are used here solely to identify the product being compared. PivoGraph is an independent product and is not affiliated with, sponsored by, or endorsed by GraphPad Software or any other software vendor. Product details can change; consult the vendor’s website for current information.