
Make a graph
How to make a line graph with error bars (mean ± SEM over time)
To draw a line graph with error bars in PivoGraph, use an XY table: the X column holds the time points, and each group is a data set with one subcolumn per replicate, for example one per mouse. In Graph View choose Points & line with error bars, then set Plot to Mean and Error and pick SD, SEM or 95% CI under Error in Format Plot. The means and error bars are calculated from the replicate values at every time point.
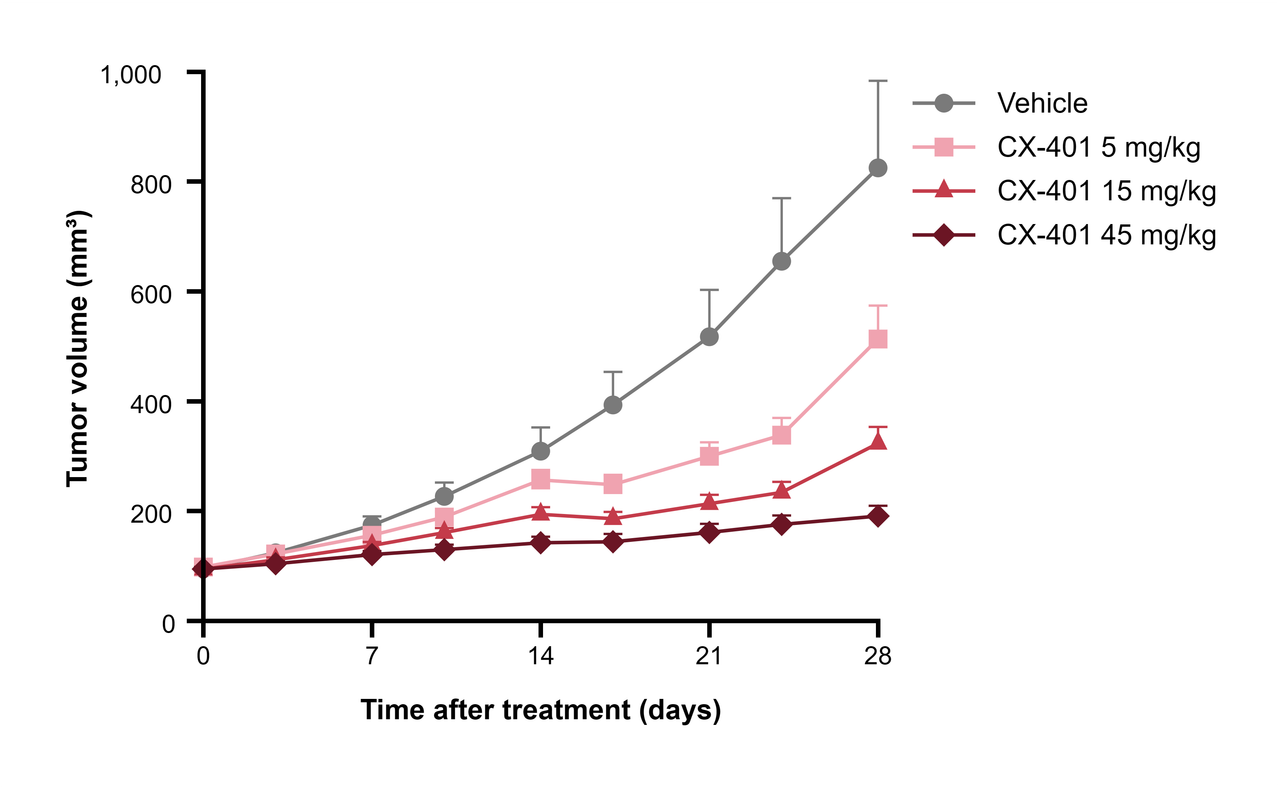
Enter the data
- In the Data Tables sidebar, click Create a new data table.
- Set Table Format to XY, set Replicates to the number of animals or wells per group, and click Create.
- Enter the time points in the X column, one per row.
- Give each data set a group name (for example Vehicle or 15 mg/kg) and enter the replicate values side by side in its subcolumns.
Keep each animal in the same subcolumn on every row, so the data stay ready for graphs that connect individual animals.
Choose the graph type
- Switch to Graph View, click the graph type name above the graph, and choose Points & line with error bars.
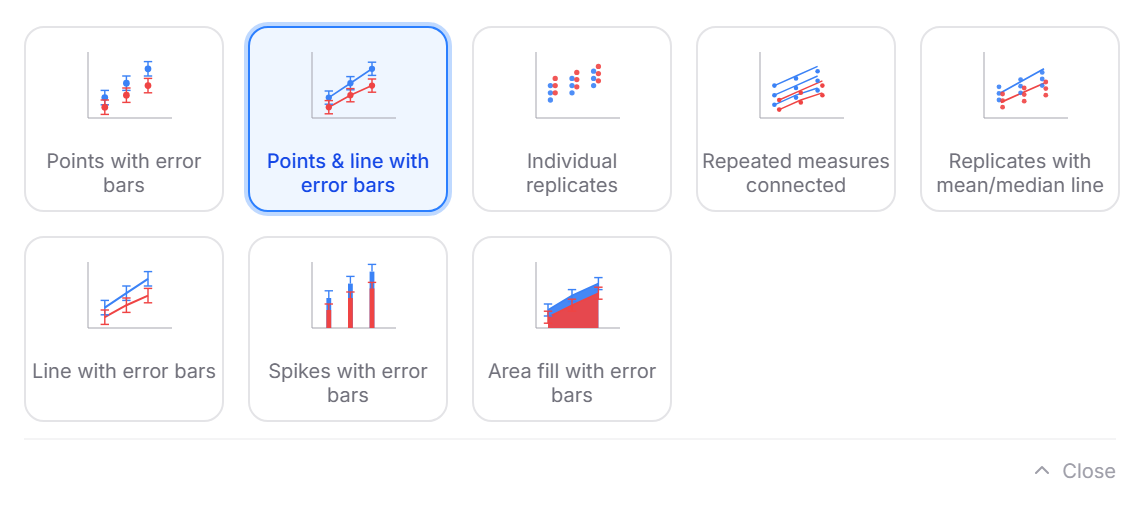
The same list offers Points with error bars without lines, Line with error bars without symbols, Area fill with error bars, and Individual replicates or Repeated measures connected for showing every animal.
Choose mean ± SD or SEM
- Click Plot in the panel bar on the right to open Format Plot.
- Under Plot, choose Mean and Error; under Error, choose SD, SEM or 95% CI.
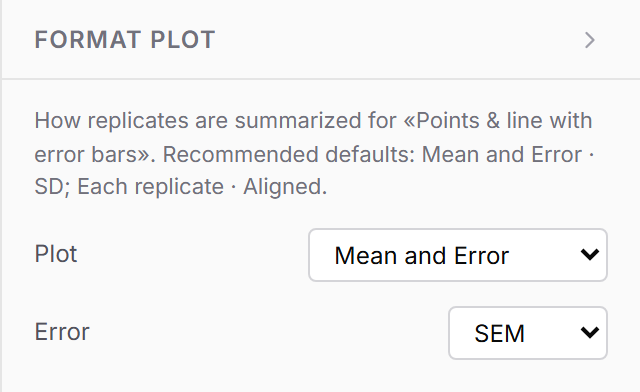
Growth curves are often shown as mean ± SEM with n in the legend. To decide between SD and SEM, see SD vs SEM: which error bars should a figure show?
Finish the figure
- Set the axis ranges and tick intervals in Format Axes, for example 0 to 28 days with ticks every 7 days.
- Change line and symbol styles for each group in Format Graph.
- When groups overlap, a legend helps readers tell them apart; it is set up under Format Graph.
Frequently asked questions
How do I compare the growth curves? On the Analysis panel, Area under curve gives one number per group that summarizes the whole curve. For a straight-line trend, use Linear regression; see How to make a scatter plot with a regression line.
Can I put time on a log scale? Yes. In Format Axes, set Scale to Log 10 or Log 2.
My X values are categories, not numbers. Use a Grouped table instead, which places categories along the X axis.