
Local-first scientific graphing
Scientific graphs in your browser
PivoGraph turns scientific tables into publication figures in the browser. Type or paste data into a table, edit interactively, analyze on your machine, and export journal-ready files up to 1200 dpi—free, with no account and no research-data upload.
- Data stays localResearch data stays in this browser
- Interactive editingGraphs and analyses update as you work
- Journal-readyClear axes and symbols for print
- 300–1200 dpiRaster and vector export
- Save & reopenContinue from a local
.pivographproject file
Editable scientific graph examples
Start from a finished figure
Explore the full example gallery, then open any example as an editable local project with its data, analyses, formatting, and annotations intact.
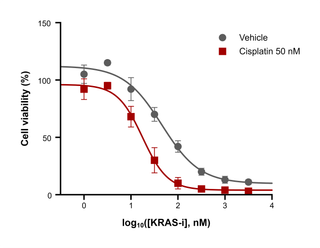
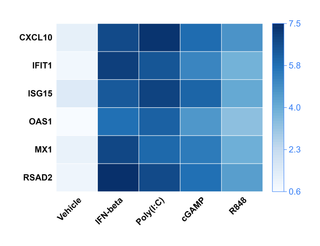
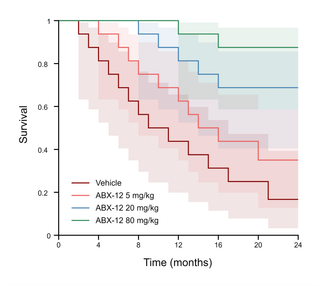
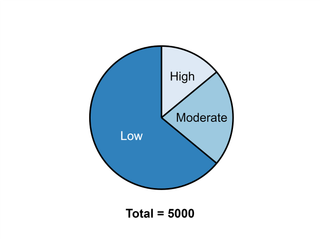
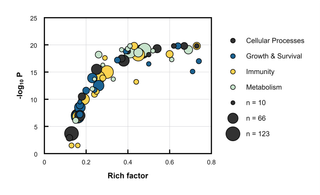
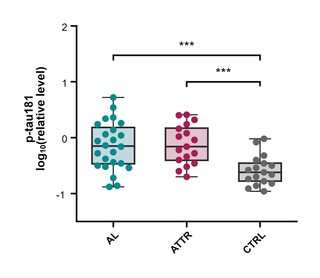
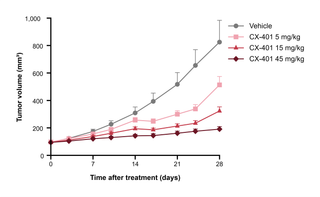
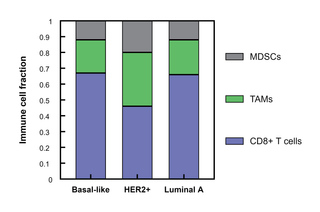
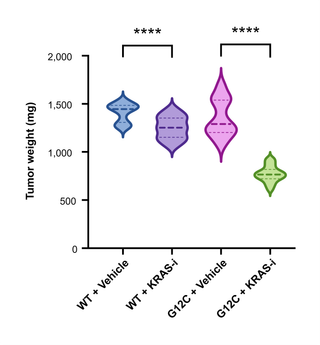
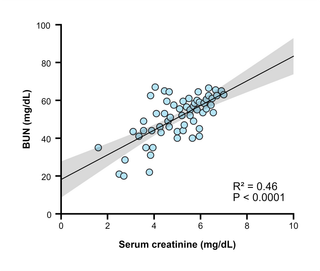
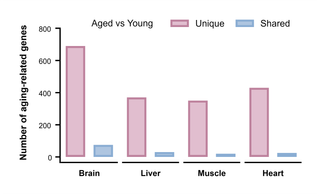
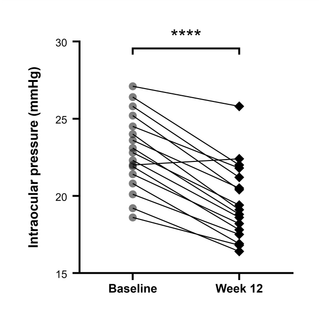
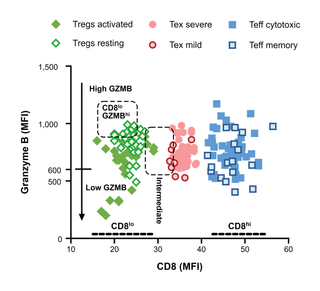
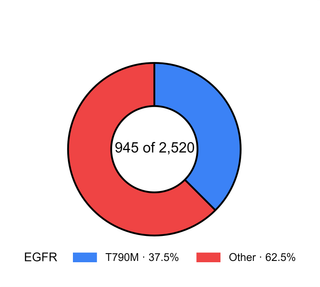
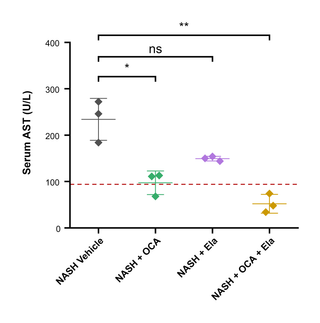
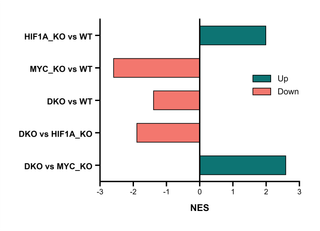
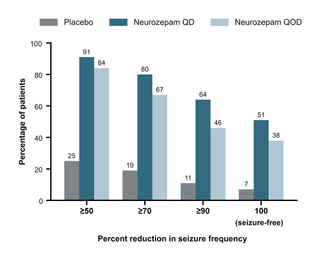
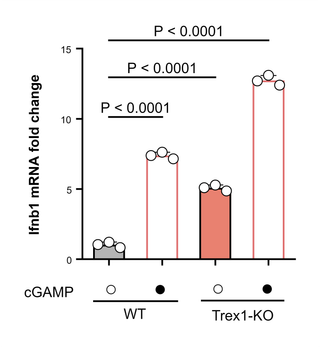
These examples use synthetic data created to demonstrate plotting and analysis workflows; the relationships shown are not research findings.
Browse the full example galleryA complete figure workflow
From data table to submission file
Data stays local
Your tables, analyses, and exports never leave this browser. Research data stays on your device—open the site, type or paste into a table, and work entirely on-device.
Interactive editing
Shape Column, XY, Grouped, Nested, Contingency, and Survival graphs as you go: axes, series, annotations, and significance brackets update live. Descriptive statistics and pairwise t-tests live in the same workspace.
Journal-ready figures
Built around what journals typically ask for: sharp axes and symbols that stay clear in print, layouts suited to papers and posters, and submission-ready raster or vector output ready for production.
High-res multi-format export
Export PNG, JPG, TIFF, SVG, PDF, and EPS. Bitmap output goes from 300 dpi for typical submissions up to 1200 dpi—free, with no watermark.
Save and reopen your project
Save data tables, analyses, graph formatting, titles, and annotations in one local .pivograph file. Open it later to continue editing, keep it with a manuscript, or send it to a collaborator for review. Learn about project files.
Start with a blank table or a complete example
Build from scratch, or open an example and replace its synthetic data while keeping the graph structure and styling.