
Statistics
How to run a one-way ANOVA with Tukey or Dunnett multiple comparisons
A one-way ANOVA tests whether the means of three or more groups differ. In PivoGraph, enter the groups as columns, choose One-way ANOVA (three or more groups) in the Analysis panel, and pick a multiple-comparison test: Tukey to compare every pair, or Dunnett to compare each group with a control. The ANOVA table, the multiple comparisons and the significance letters appear on the Results tab, ready to place on the graph.
Set up the analysis
- Enter each group as a column of a Column table, with at least three columns that contain values.
- Open the Analysis panel (Analyze → Open Analysis Panel) and, on the Method tab, choose One-way ANOVA (three or more groups).
- On the Parameters tab, answer three questions. The Will perform box shows the test your answers lead to.
| Experimental design | Distribution | Assume equal SDs? | Test |
|---|---|---|---|
| Independent groups | Normal (compare means) | Yes | Ordinary one-way ANOVA |
| Independent groups | Normal (compare means) | No | Welch and Brown-Forsythe ANOVA |
| Matched (each row is one subject) | Normal (compare means) | — | Repeated-measures one-way ANOVA with the Geisser-Greenhouse correction |
| Independent groups | Nonparametric (compare ranks) | — | Kruskal-Wallis test |
| Matched (each row is one subject) | Nonparametric (compare ranks) | — | Friedman test |
Choose the multiple comparisons
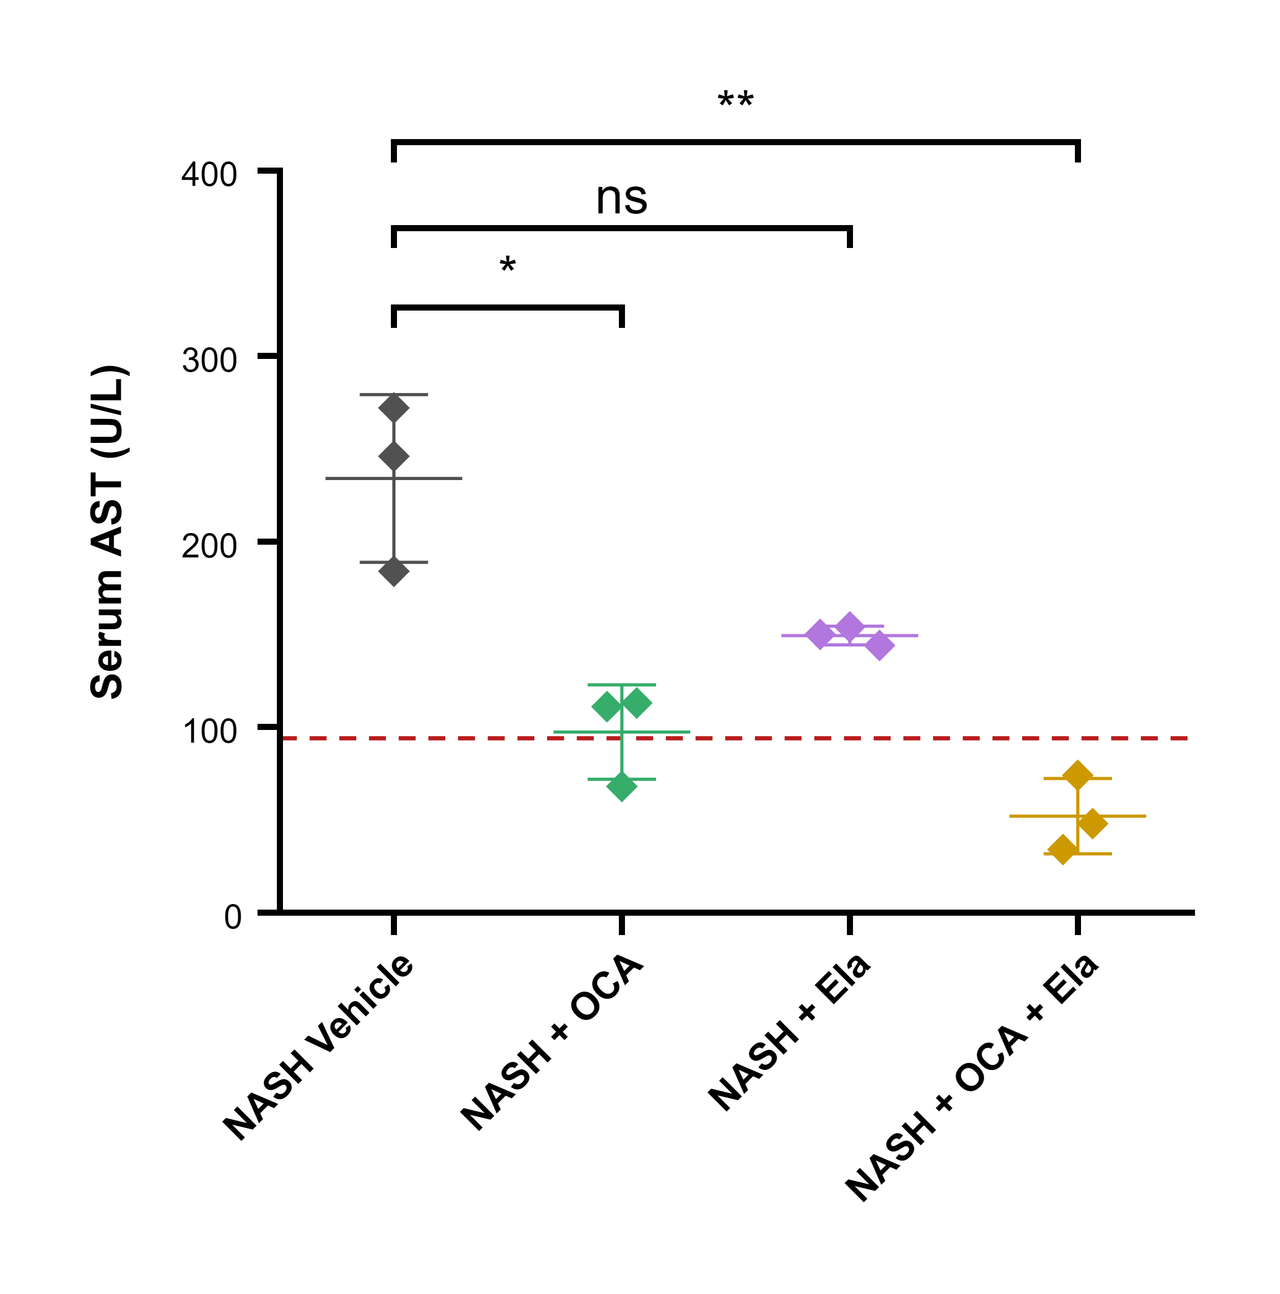
- Under Multiple comparisons, choose Compare every pair of columns, Compare each column with a control (then pick the Control), or Compare selected pairs. In the sample data, NASH Vehicle is the control, so choose Compare each column with a control.
- Under Correction for multiple comparisons, the recommended method for your choices is listed first and marked as recommended:
| Situation | Recommended correction |
|---|---|
| Every pair of columns | Tukey |
| Each column with a control | Dunnett |
| Selected pairs | Šídák |
| SDs not assumed equal (Welch ANOVA) | Dunnett T3 |
| Nonparametric test | Dunn |
Bonferroni, Holm–Šídák, false discovery rate control (two-stage step-up or Benjamini–Hochberg) and uncorrected comparisons such as Fisher's LSD are in the same list.
Read the results
The Results tab shows:
- The main test: F with its degrees of freedom (DFn, DFd), the P value and R². A small P value, such as P < 0.05, means that at least one group mean differs from the others; the multiple comparisons show which.
- Are the SDs equal?: the Brown–Forsythe and Bartlett tests. When their P value is small, consider answering No to Assume equal SDs? to run Welch ANOVA.
- ANOVA table: sums of squares, degrees of freedom and mean squares.
- Data summary: n, mean and SD of each group. When every pair is compared, it also shows significance letters: groups that share a letter do not differ significantly.
- The multiple comparisons: for each pair, the difference (first column minus second), its confidence interval and the adjusted P value.
Add the results to the graph
- Switch to Graph View and click Add brackets to graph on the Results tab. Significant comparisons are drawn as stacked brackets with stars; tick Also place non-significant (ns) comparisons to show all of them. See How to add significance stars to a graph for the star thresholds.
Frequently asked questions
Why not run a t-test on every pair? Each extra test adds another chance of a false positive. A multiple-comparison correction keeps the overall false-positive rate at the significance level you choose (5% by default).
Tukey or Dunnett? Use Tukey when every pair matters. Use Dunnett when each treatment only needs to be compared with a control: fewer comparisons give each one more power.
What if the data are not normally distributed? Choose Nonparametric (compare ranks) to run the Kruskal-Wallis test with Dunn's multiple comparisons. For small samples, PivoGraph reports an exact P value.
Are the results accurate? The ANOVA, every correction and the nonparametric tests are compared value by value with R on the validation page.