
Statistics
How to do a t-test: unpaired, paired and Mann–Whitney
A t-test tells you whether the means of two groups differ by more than chance would explain. In PivoGraph, enter the two groups as columns of a Column table, open the Analysis panel, choose t-test (two groups), and set the design on Parameters: Unpaired for independent groups, Paired when the same subjects were measured twice. The P value, the 95% confidence interval of the difference and the effect size appear on Results.
Which test to choose
| Your data | Experimental design | Distribution | Test |
|---|---|---|---|
| Two independent groups, such as control and treated mice | Unpaired | Normal (compare means) | Unpaired t-test (Welch's or Student's) |
| The same subjects measured twice, such as before and after treatment | Paired | Normal (compare means) | Paired t-test |
| Independent groups with clearly skewed values or scores | Unpaired | Nonparametric (compare ranks) | Mann-Whitney test |
| Paired values whose differences are clearly not normal | Paired | Nonparametric (compare ranks) | Wilcoxon matched-pairs signed rank test |
For unpaired data, Variance offers Welch's t-test (does not assume equal SDs, the default) and Student's t-test (assumes equal SDs).
Run the test
- Enter each group in its own column of a Column table. For a paired design, keep each subject on the same row in both columns.
- Click Analysis in the panel bar on the right, or choose Analyze → Open Analysis Panel.
- On Method, choose t-test (two groups).
- On Parameters, pick the two columns under Compare, then set Experimental design and Distribution.
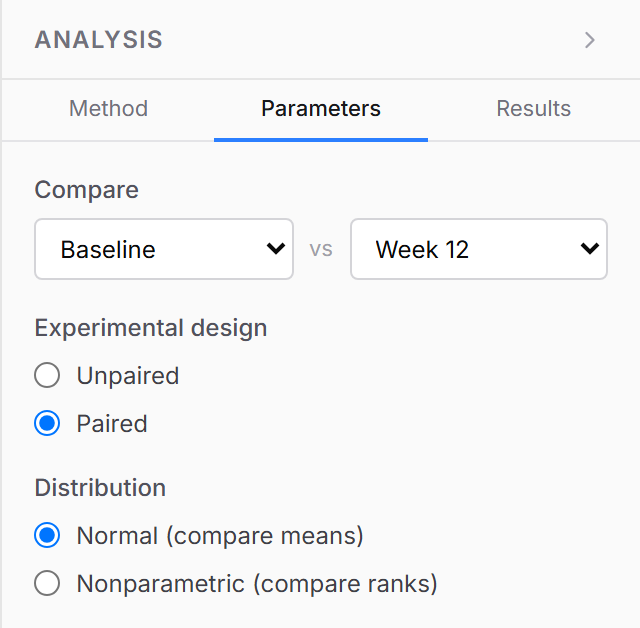
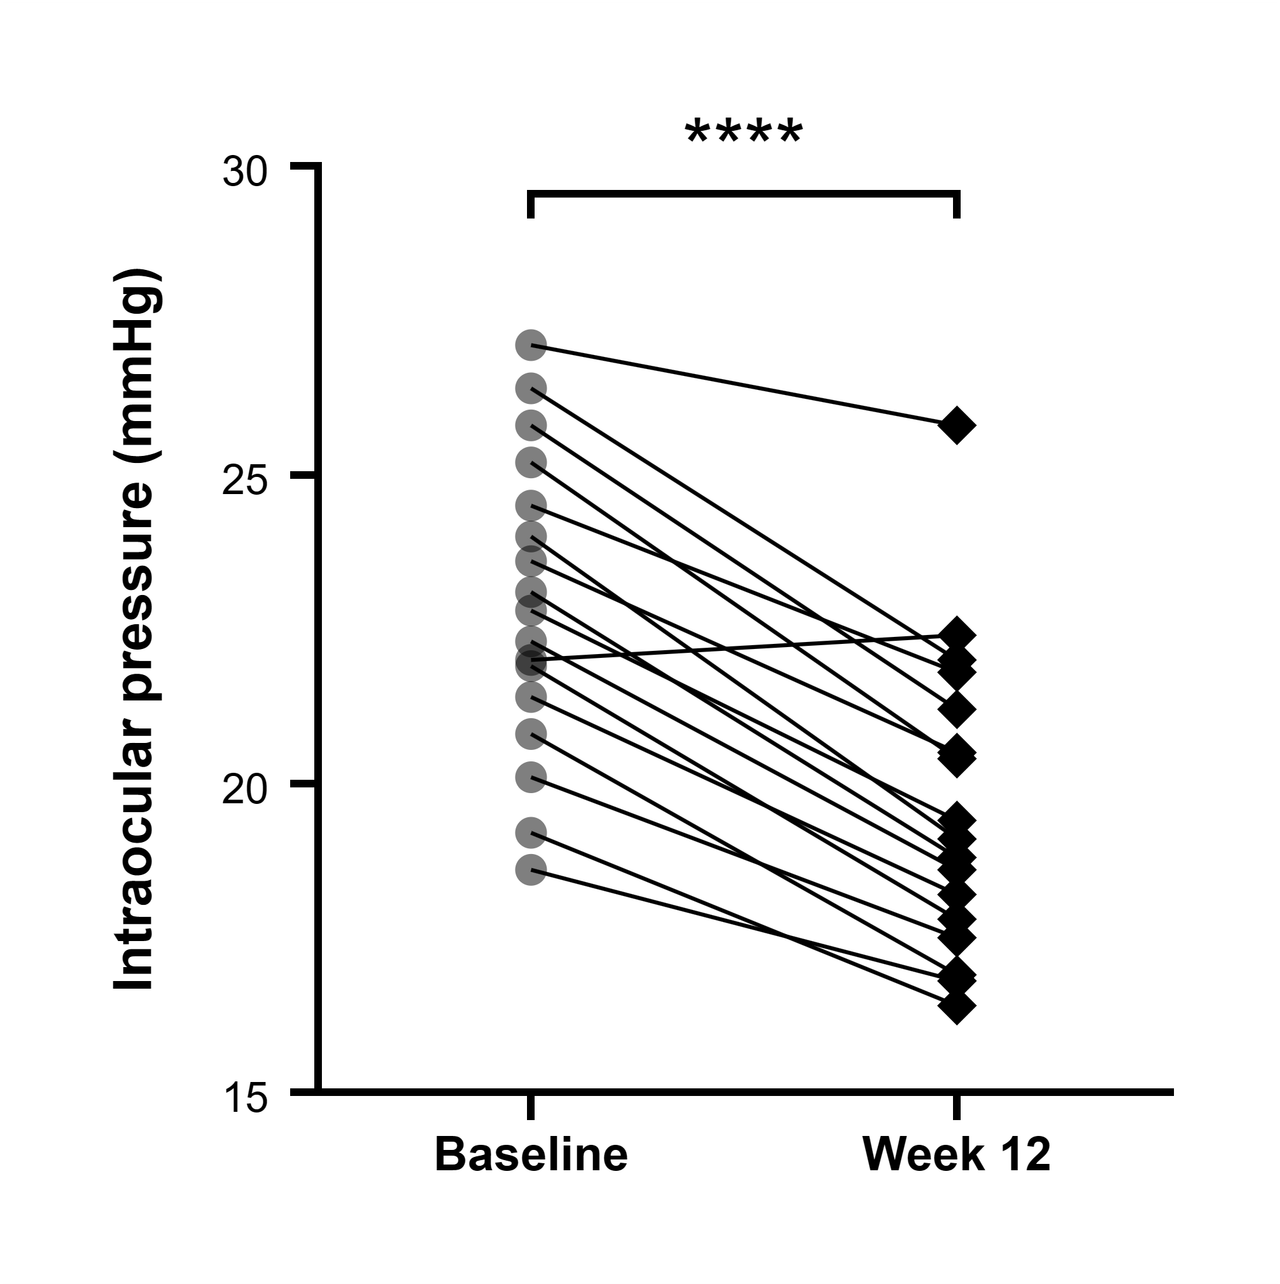
When the graph is a before-after plot, PivoGraph starts the test as Paired.
Read the results
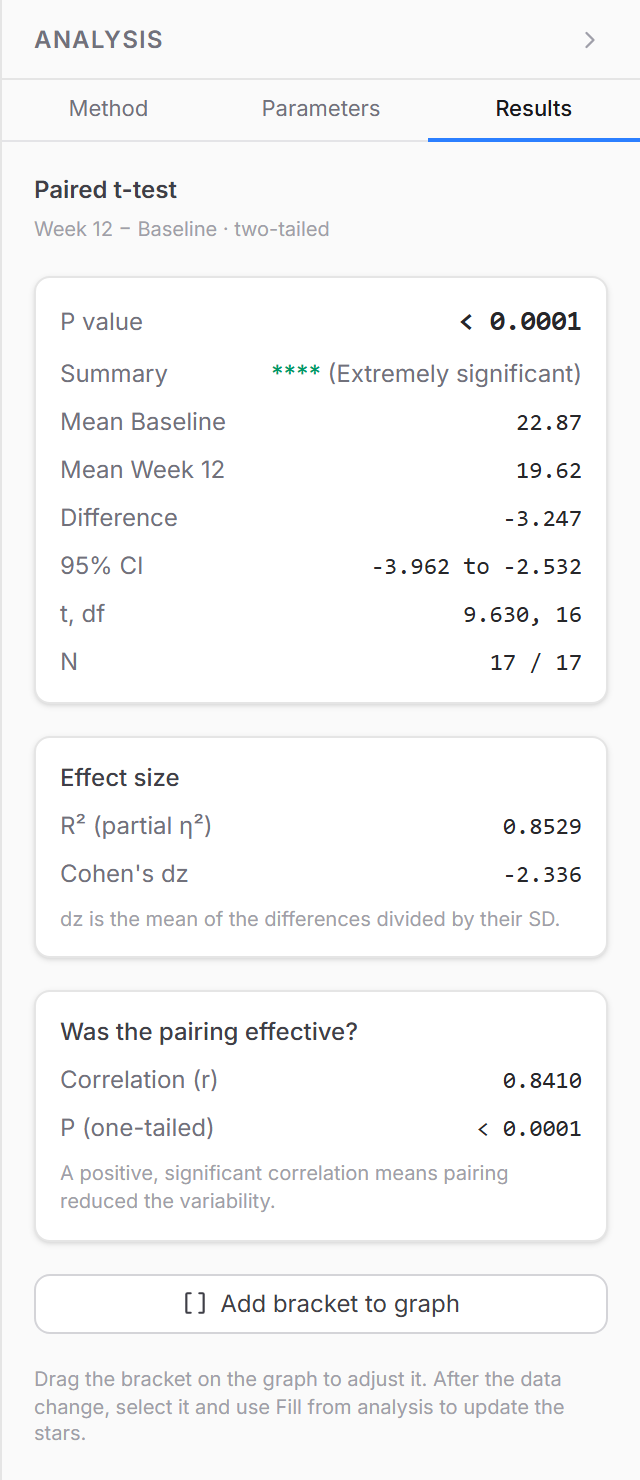
- P value and Summary: the two-tailed P value and its star rating.
- Difference and 95% CI: how far the second column's mean lies from the first, with its confidence interval. An interval that does not include 0 matches P < 0.05.
- t, df and N: the test statistic, degrees of freedom and number of values per group.
- Effect size: R² and Cohen's dz for paired data; R², Cohen's d and Hedges' g for unpaired data.
- Was the pairing effective? (paired) shows the correlation between the two columns. F test to compare variances (unpaired) checks whether the two SDs differ.
In the sample data, pressure in 17 eyes fell from 22.87 to 19.62 mmHg, a mean difference of −3.25 mmHg (95% CI −3.96 to −2.53). In a paper this reads: paired t-test, t(16) = 9.63, P < 0.0001, n = 17.
Show the result on the graph
Switch to Graph View and click Add bracket to graph on Results. The bracket connects the two groups and shows the stars for the P value. For the star thresholds and how to adjust the bracket, see How to add significance stars to a graph.
Frequently asked questions
Paired or unpaired? Use paired when every value in one group has a natural partner in the other: the same animal, patient, eye or batch. Pairing removes the variation between subjects, so a real difference is easier to detect.
Welch's or Student's t-test? Welch's t-test does not need equal SDs and works well when they are equal, which is why it is the default. Choose Student's t-test when your protocol specifies it.
When should I use the Mann–Whitney test? When the values are clearly skewed, are scores or ranks, or contain outliers that belong in the data. It compares ranks instead of means, and PivoGraph gives an exact P value for small samples.
I have three or more groups. Use a one-way ANOVA with multiple comparisons instead of repeated t-tests. See How to run a one-way ANOVA.
Are the results accurate? t-tests, effect sizes and the rank tests are compared value by value with R on the validation page.