
Make a graph
How to make a bar graph with error bars (SD, SEM or 95% CI)
To make a bar graph with error bars in PivoGraph, enter each group as a column of a Column table, switch to Graph View, choose Column bar graph, and pick Mean with SD, Mean with SEM or Mean with 95% CI in Format Plot. Bar heights and error bars are calculated from your raw values, so the graph follows every change you make to the data.
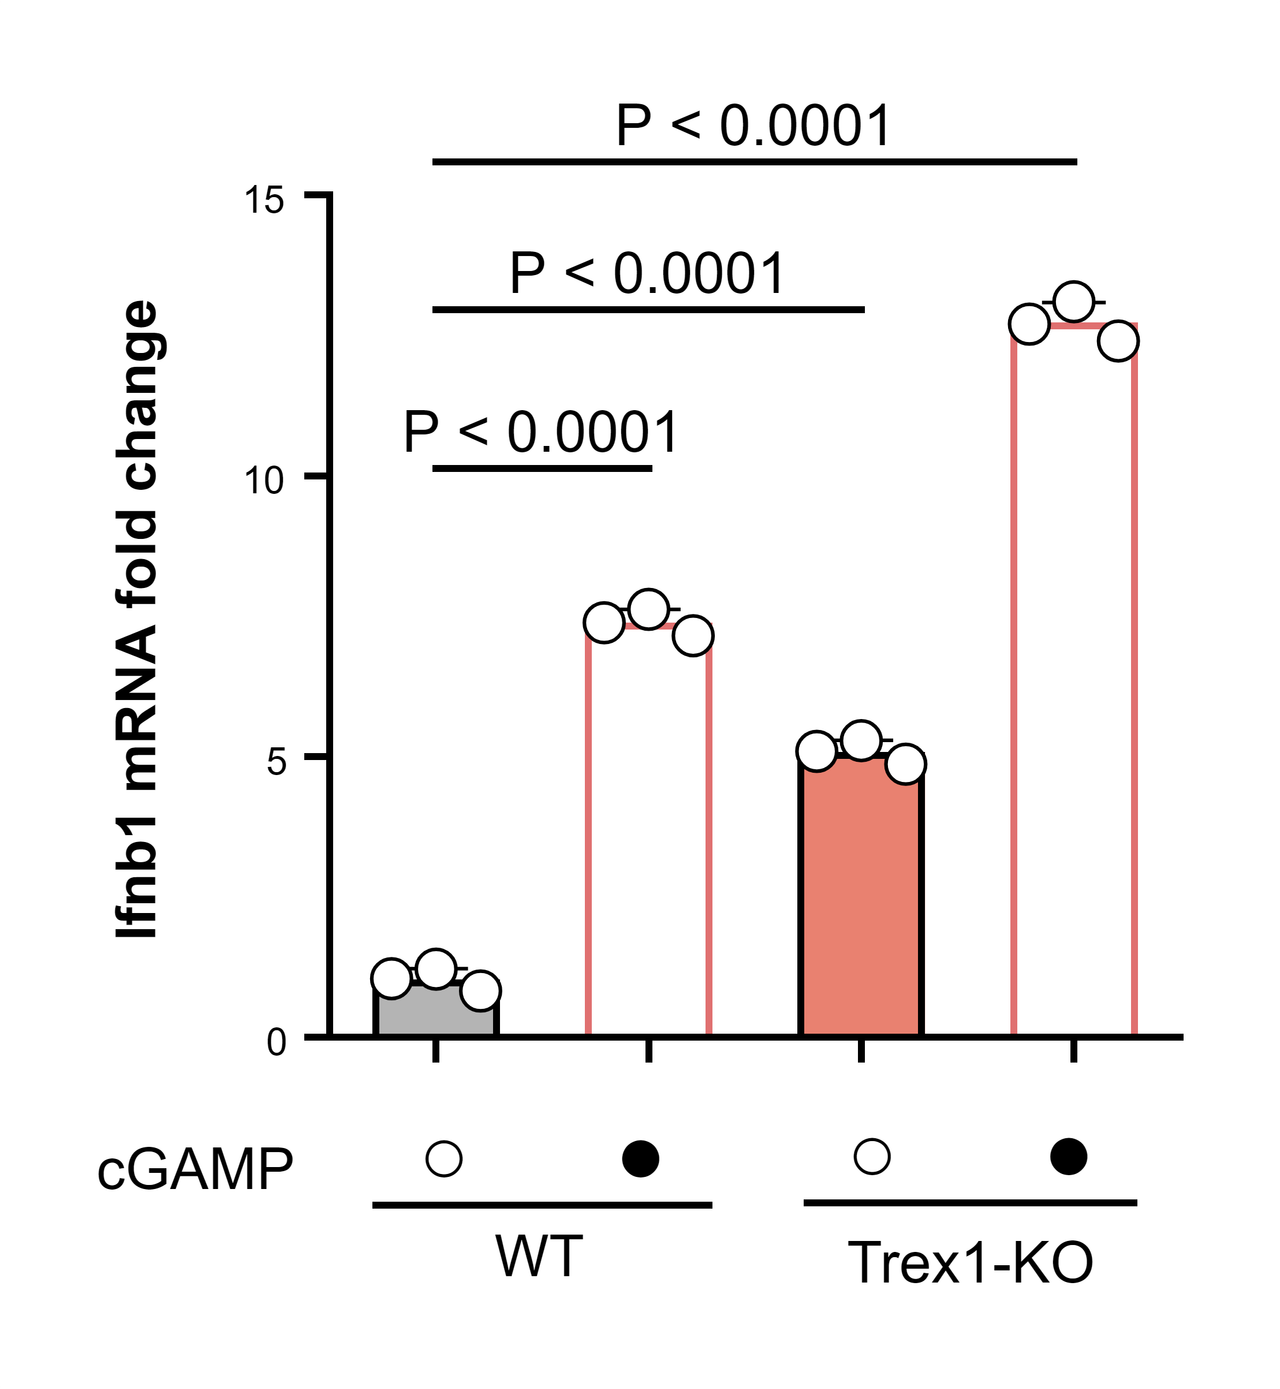
Enter the data
- Open PivoGraph and, in the Data Tables sidebar, click Create a new data table.
- Set Table Format to Column, give the table a name, and click Create.
- In Data View, enter one group per column and one measurement per row, and type the group names in the column titles (for example WT and WT + cGAMP).
Groups can have different numbers of values; empty cells are skipped. To bring in values from a spreadsheet, use File → Import Data (CSV).
Choose the graph
- Switch to Graph View.
- In the graph types along the top, under Mean/median & error, choose Column bar graph. To show every data point on top of the bars, choose Scatter plot with bar under Individual values instead.
Choose what the error bars show
- Click Plot in the panel bar on the right to open Format Plot.
- Under Plot, choose one of these options:
| Option | Bar height | Error bar |
|---|---|---|
| Mean with SD | Mean | ± standard deviation |
| Mean with SEM | Mean | ± standard error of the mean |
| Mean with 95% CI | Mean | 95% confidence interval of the mean |
The same list also offers the median with its interquartile range, the geometric mean, and more.
SD, SEM or 95% CI?
SD shows how spread out the individual values are; SEM (SD divided by √n) and the 95% CI show how precisely the mean is estimated. Whichever you choose, state it in the figure legend together with n, for example "mean ± SD, n = 3 biological replicates". An error bar needs at least two values in a group. For formulas and side-by-side examples, see SD vs SEM: which error bars should a figure show?
Export for a journal
- Fine-tune fonts, line widths and colors under Format Graph and Format Axes.
- Click Export in the panel bar on the right to open Export Graph.
- Choose TIF (or PDF or SVG for vector artwork), set Resolution (DPI) to 300 or 600, and click Export .tif. Formats and resolutions for journals are covered in How to export a 300 dpi TIFF figure for a journal.
Frequently asked questions
How do I add significance stars to the bars? Run a t-test or a one-way ANOVA on the table and place the results as brackets. See How to add significance stars to a graph.
Can I draw the bars horizontally? Yes. Tick Flip XY in Format Plot.
Which values go into the mean and SD? All values in each column. The SD is the sample SD (n − 1), and these calculations are compared value by value with R on the validation page.