
Prepare for journals
How to export a 300 dpi TIFF figure for a journal (or PDF and EPS)
Open the graph in Graph View, click Export in the panel bar on the right, choose TIF, set Resolution (DPI) to 300 or 600, and click Export .tif. The TIFF is lossless and carries its DPI in the file. For vector artwork, choose PDF, EPS or SVG instead; vector files stay sharp at any size.
Which format and resolution
Most journals ask for one of these, so check the author guidelines of your target journal:
| Figure content | Format | Resolution |
|---|---|---|
| Graphs and text only (line art) | TIF | 600 or 1200 DPI |
| Graphs combined with photos or micrographs | TIF | 300 or 600 DPI |
| Journals that accept vector artwork | PDF or EPS | Not needed: vector files have no pixels |
| Slides, posters and web pages | PNG | 300 DPI |
Resolution is counted at the size the figure will be printed. A graph exported at 300 DPI and then enlarged to twice its size in a layout program ends up at 150 DPI, so export at the final size.
Export a TIFF
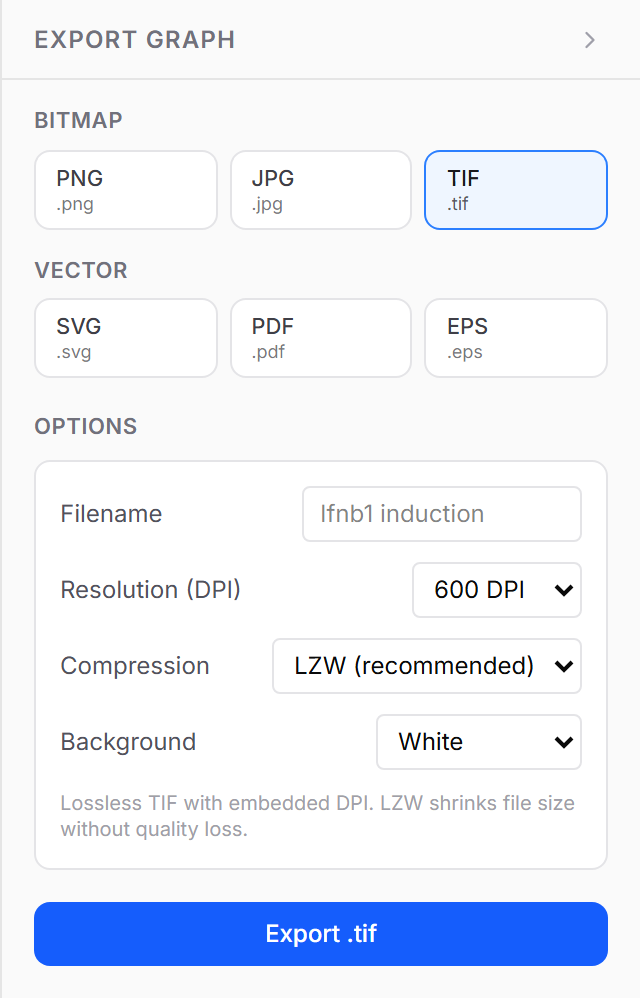
- Open the graph in Graph View.
- Click Export in the panel bar on the right to open Export Graph.
- Under Bitmap, choose TIF.
- Set Resolution (DPI) to 300 DPI, 600 DPI or 1200 DPI.
- Keep Compression at LZW (recommended): it makes the file smaller without losing any detail. Choose None only if a submission system rejects compressed TIFFs.
- Keep Background at White for print, enter a Filename, and click Export .tif.
Export a vector PDF or EPS
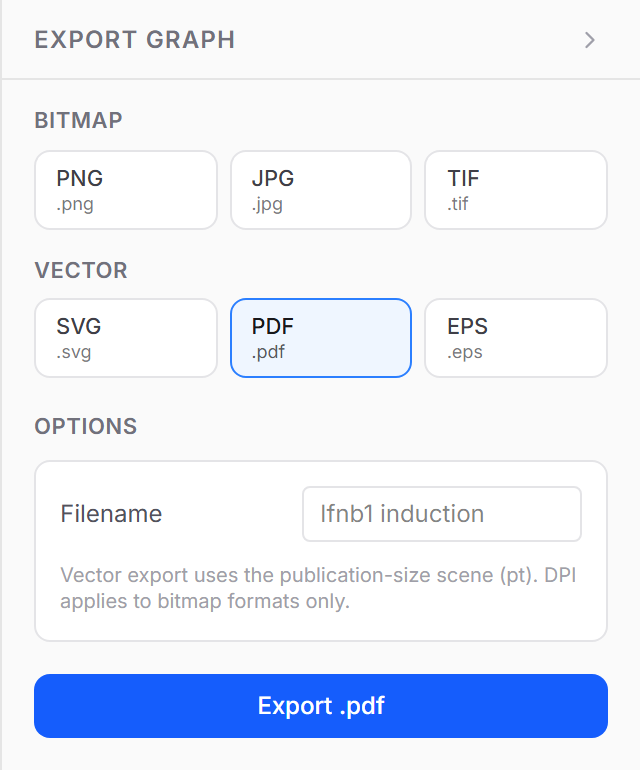
Under Vector, choose PDF, EPS or SVG and click the export button. The Resolution (DPI) setting applies only to bitmap formats; vector files keep every line and letter as shapes, and you can open them in vector editing programs to assemble a multi-panel figure.
Check before you submit
- Font size: text sizes in PivoGraph are set in points (pt). Many journals ask for 6–8 pt or larger at final size.
- Line width: very thin lines can disappear in print; 0.5 pt or more is a safe minimum for axes and error bars.
- Legend: state what the error bars show and n for each group; see SD vs SEM.
- File name: name each file after its figure number, for example Figure2A.
Frequently asked questions
Is 300 DPI enough? For figures that combine graphs with photographs, 300 DPI usually is. For graphs and text alone, many journals ask for 600 DPI or more, because thin lines and small text need the extra detail.
Why is my TIFF so large? TIFF stores every pixel. LZW compression shrinks it without any loss; choosing PDF or EPS keeps files small at any size.
PDF or EPS? Both are vector formats. Use the one the journal's submission system lists; PDF is the more common choice today.
Is my graph uploaded anywhere? No. PivoGraph creates the file in your browser and saves it directly to your computer.