
Statistics
How to calculate IC50 or EC50 from a dose–response curve (4PL fit)
Enter the concentrations in X and the responses, such as % viability, in an XY table, then open the Analysis panel and choose Nonlinear regression (dose–response). PivoGraph fits a four-parameter logistic curve with variable slope and reports Bottom, Top, EC50 and Hill slope. For an inhibition curve the Hill slope is negative, and the EC50 is the IC50: the concentration that gives a response halfway between Bottom and Top.
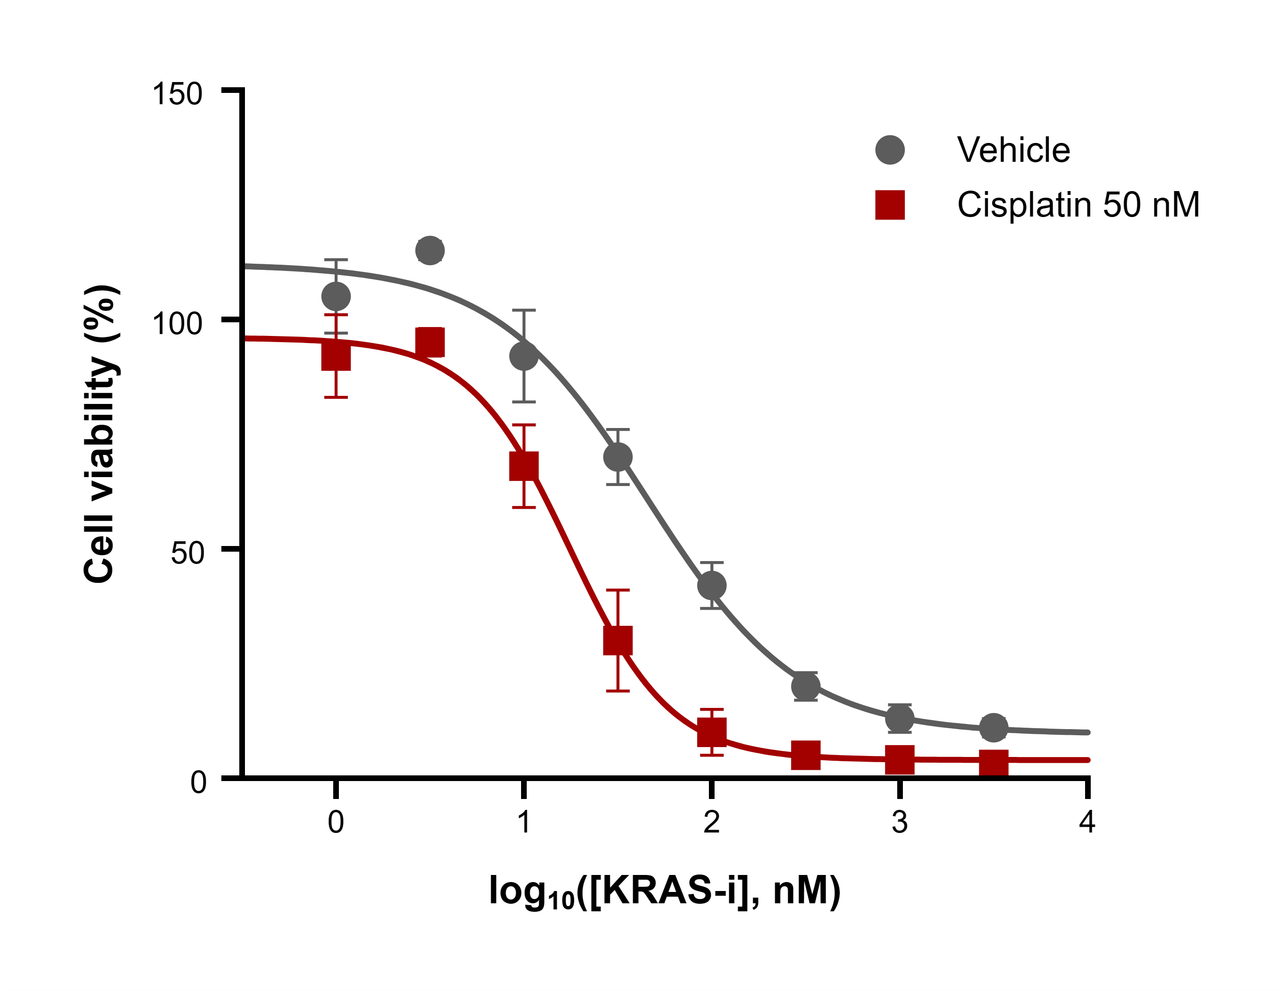
Enter the data
- In the Data Tables sidebar, click Create a new data table, set Table Format to XY, set Replicates to the number of wells per concentration, and click Create.
- Enter one concentration per row in X, either as the concentration itself or as its log10.
- Enter the responses for each treatment as a data set, replicate wells side by side. Every replicate counts as a point in the fit.
Choose the equation
- Click Analysis in the panel bar on the right and choose Nonlinear regression (dose–response) on Method.
- On Parameters, choose the Equation that matches your X values.
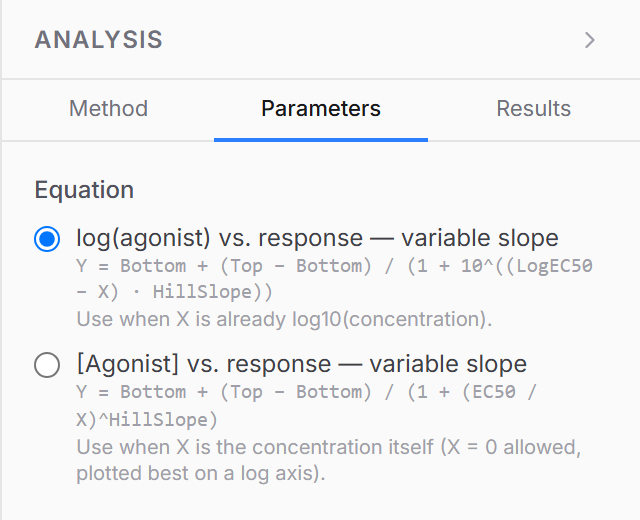
- log(agonist) vs. response — variable slope: X is already log10(concentration).
- [Agonist] vs. response — variable slope: X is the concentration itself. X = 0 is allowed, and the curve reads best on a log X axis (Format Axes → Scale → Log 10).
Both equations fit falling curves as well as rising ones; the sign of the Hill slope sets the direction.
Read the results
| Result | Meaning |
|---|---|
| Bottom, Top | The lower and upper plateaus of the curve |
| LogEC50, EC50 | Concentration halfway between Bottom and Top; EC50 = 10^LogEC50, in the concentration units of your data |
| Hill slope | Steepness at the midpoint; negative when the response falls with dose |
| R², Sy.x | How closely the curve follows the points |
| Points fitted | Number of points used |
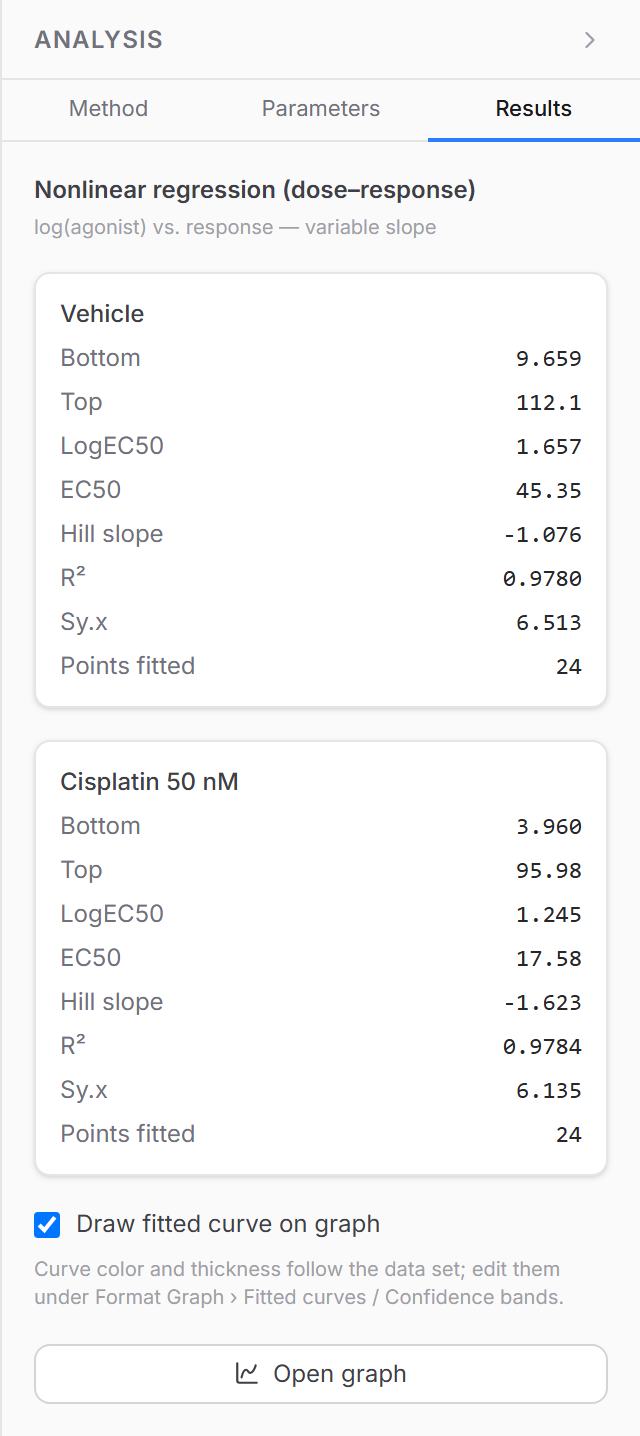
In the sample data the EC50 is 45.35 for vehicle and 17.58 with cisplatin 50 nM, so the combination shifts the curve to lower concentrations. Both Hill slopes are negative, as expected for an inhibition curve.
Draw fitted curve on graph on Results adds the curve to the graph in the color of its data set; change its width or color under Fitted curves in Format Graph.
Get a good fit
- Include concentrations that reach both plateaus: a fit needs at least 5 points with a clear S-shaped trend.
- Space the concentrations evenly on a log scale, for example half-log or 3-fold dilutions.
- If responses are normalized to controls (% of vehicle), Top and Bottom stay close to 100 and 0.
Frequently asked questions
IC50 or EC50? The same parameter under two names: EC50 for a stimulating effect, IC50 for an inhibiting one. Report it with its concentration unit, for example IC50 = 17.6 nM.
Why does the fit fail? The data probably do not show an S-shaped curve yet, for example when the highest concentration has not reached the bottom plateau. Add concentrations at the ends of the range.
Can I compare several treatments? Yes. Each data set is fitted separately, and its EC50 appears in its own card on Results.