
Using PivoGraph
How to import data from Excel (CSV) into PivoGraph
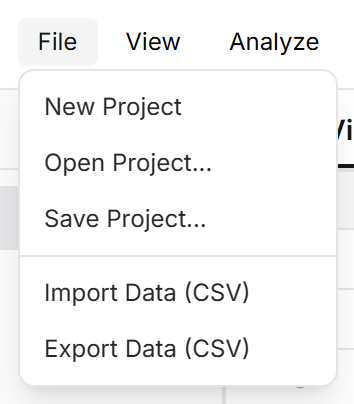
PivoGraph imports data as CSV files. In Excel, save the sheet with File → Save As and the file type CSV UTF-8 (Comma delimited). Then, in PivoGraph, choose File → Import Data (CSV), pick the file, check the table format and whether the first row holds column titles, and click Import. The file is read in your browser and is not uploaded anywhere.
Lay out the sheet
Arrange the sheet the way the table will look in PivoGraph:
- One group per column, with the group names in the first row, for example Vehicle, Drug A, Drug B.
- One value per cell. Leave a cell empty when a value is missing; groups can have different numbers of values.
- Numbers only in the data cells: no units, no "n.d." and no formulas that show errors.
For two-way layouts, put the row names in the first column (Grouped table), or put X values in the first column (XY table).
Save as CSV UTF-8
- In Excel, choose File → Save As.
- Under the file type, choose CSV UTF-8 (Comma delimited) (*.csv) and save.
UTF-8 keeps characters such as µ, ± and non-English group names intact. Only the active sheet is saved, so save each sheet you need as its own file.
Import into PivoGraph
- Choose File → Import Data (CSV) and pick the CSV file.
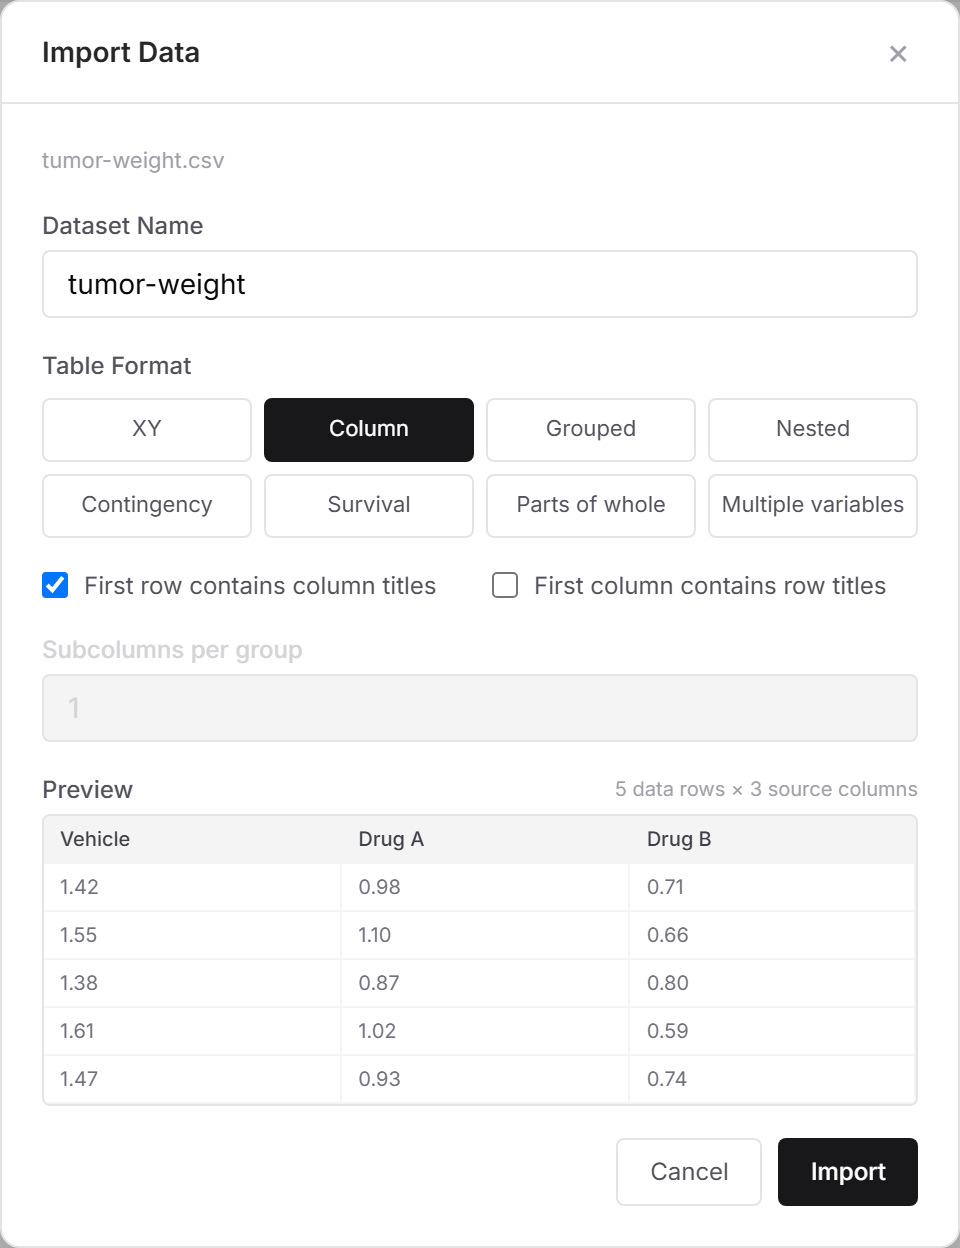
- In the Import Data dialog, check the settings:
- Dataset Name: taken from the file name; change it if you like.
- Table Format: PivoGraph suggests one from the file's layout. It decides which graphs and analyses the table offers.
- First row contains column titles and First column contains row titles: tick them to match your sheet.
- Subcolumns per group: for replicate values side by side, such as triplicate wells.
- Preview: the first rows and the size of the data, so you can confirm the columns line up.
- Click Import. The new table opens in Data View.
Choose the table format
| Your data | Table Format |
|---|---|
| Groups side by side, such as control and treatments | Column |
| X values in the first column and Y values next to them | XY |
| Rows and columns are both groups, such as genotype × treatment | Grouped |
| Time to event with a 1/0 event code per subject | Survival |
| One row per observation, one column per variable | Multiple variables |
Frequently asked questions
PivoGraph says the file is not valid UTF-8. The file was saved in another encoding. Save it again from Excel as CSV UTF-8 (Comma delimited).
Some cells are not numbers. The dialog lists how many values are not numeric and where the first one is. Fix them in Excel, or tick Import these values as missing.
Can I paste values instead? Yes. Copy cells in Excel and paste them into a table in Data View.
How do I get the data back out? File → Export Data (CSV) saves the selected table as a CSV file that Excel opens directly.
What next? Make a graph from the table, for example a bar graph with error bars or a box plot.