
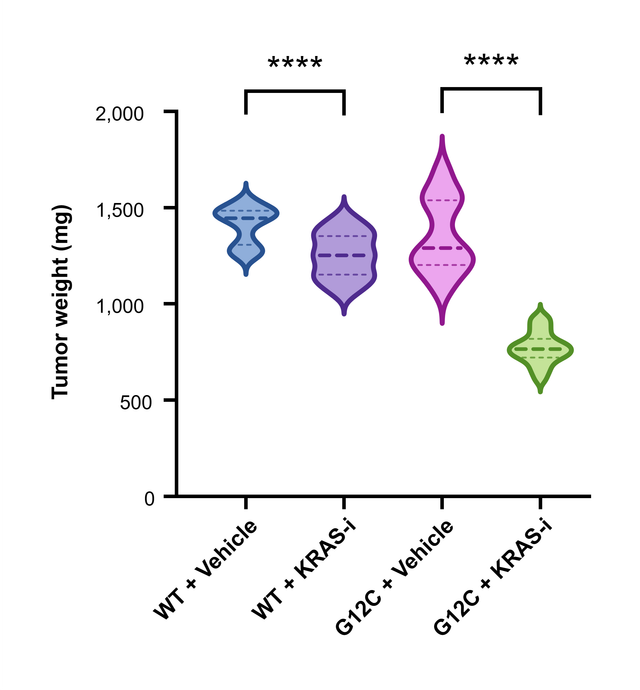
The data you need
A Column table with one group per column and one value per row, for example tumor weight per mouse in each treatment group. Groups can have different numbers of values, and empty cells are skipped. Type or paste the values, or bring them in with File → Import Data (CSV).
What you can adjust
- Median and Quartiles: the lines inside each violin, shown by default. Change their color, thickness and pattern, or turn them off, in Format Graph.
- Symbols: tick this card in Format Graph to plot every data point, underneath the violin or on top of it.
- Violin: the fill, the border and the Smoothing of the shape (Low, Medium or High).
- Show truncated violin plot in Format Plot ends each violin at the smallest and largest value, and Flip XY lays the violins horizontally.
The shape is a Gaussian kernel density estimate. The median and quartiles use the (n + 1)p rule, the same definition as R's quantile(type = 6).
Statistics on the same graph
Run an unpaired or paired t-test, a Mann–Whitney test or a one-way ANOVA with multiple comparisons on the table, and place the results above the violins as brackets with stars, as shown in How to add significance stars to a graph. The t-tests are compared value by value with R on the validation page.
Export for a journal
Export the figure as TIFF at up to 1200 dpi, or as PDF, EPS or SVG vector artwork. Fonts, line widths and colors are set in Format Graph and Format Axes. Formats and resolutions for submission are covered in How to export a 300 dpi TIFF figure for a journal.
Frequently asked questions
Violin plot or box plot? A box plot summarizes each group with the median, quartiles and whiskers. A violin plot adds the shape in between, such as two peaks or a long tail. With only a few values per group, a box plot or the individual points are easier to read.
Can I show the data points and the violin together? Yes. Tick Symbols in Format Graph.
Can I switch to a box plot later? Yes. Click the graph type name above the graph and choose Box & whiskers in the same Box and violin group; the data stays as it is.