
Statistics
SD vs SEM: which error bars should a figure show?
SD (standard deviation) describes how much the individual values vary. SEM (standard error of the mean) describes how precisely the mean is estimated, and equals SD divided by √n. Show SD when readers should see the spread of the data; show SEM or a 95% confidence interval when the point of the figure is to compare means. In PivoGraph you switch between them under Plot in Format Plot, and the graph redraws at once.
How they are calculated
| Statistic | Formula | As n grows |
|---|---|---|
| SD | √[ Σ(x − x̄)² / (n − 1) ] | Settles near the true spread of the population |
| SEM | SD / √n | Keeps shrinking |
| 95% CI of the mean | x̄ ± t × SEM, with t from the t distribution with n − 1 degrees of freedom | Keeps shrinking |
Because SEM divides by √n, it is always smaller than SD once a group has two or more values. With n = 3, SEM is about 0.58 × SD; with n = 17, as in the example below, about 0.24 × SD.
Same data, two kinds of error bars
Both graphs below show the same intraocular pressure values, 17 eyes at each time point.
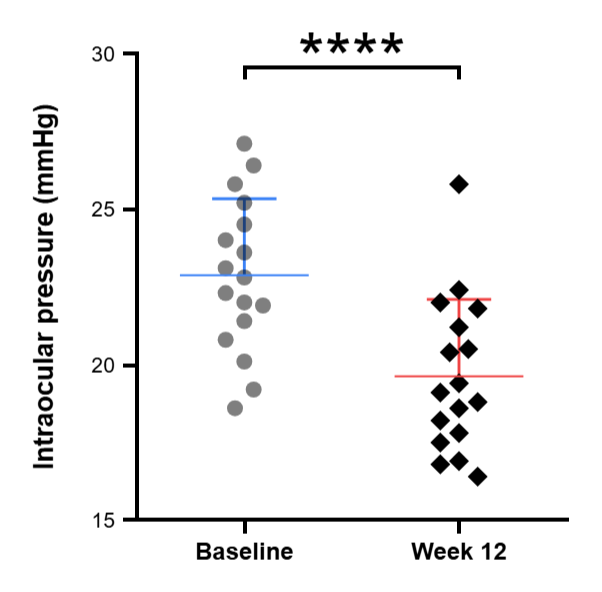
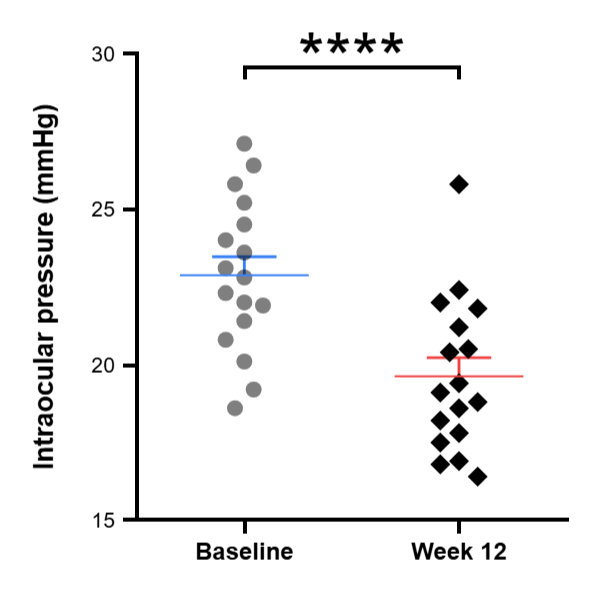
At baseline, SD is 2.46 mmHg and SEM is 0.60 mmHg. The SD bars cover most of the eyes, from about 20 to 25 mmHg. The SEM bars reach only 0.6 mmHg either side of the mean: they describe how precisely the mean is known, not the range of the eyes.
Which one to use
- SD: when the variation between samples is part of the result, for example how much animals or patients differ from each other.
- SEM: when the figure compares group means and the legend states n. With small groups, also show the individual points, as in the graphs above.
- 95% CI: when the figure compares means and readers should judge the size of the difference. If the 95% CIs of two independent groups do not overlap, the difference is significant at P < 0.05.
Whichever you choose, state it in the figure legend together with n, for example "mean ± SD, n = 17 eyes". To test whether two means differ, run a statistical test rather than comparing bar overlap; see How to do a t-test.
Switch the error bars in PivoGraph
- Open the graph in Graph View and click Plot in the panel bar on the right to open Format Plot.
- Under Plot, choose Mean with SD, Mean with SEM or Mean with 95% CI.
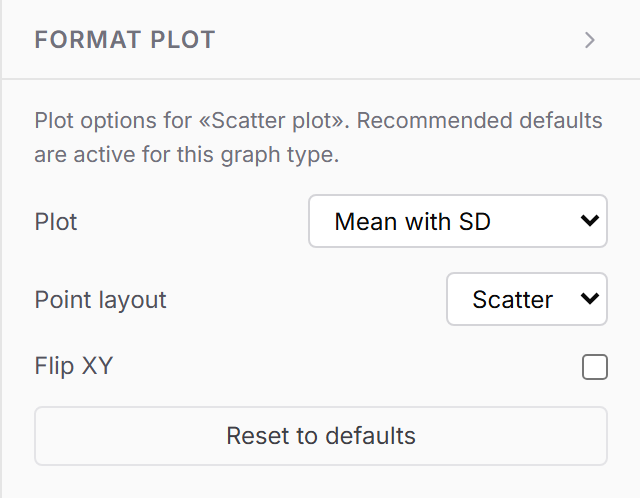
This applies to bar graphs and to scatter plots with a mean line. For XY graphs such as growth curves, choose Mean and Error under Plot and then SD, SEM or 95% CI under Error; see How to make a line graph with error bars.
Calculate SD and SEM for each column
- Click Analysis in the panel bar on the right.
- On Method, choose Descriptive statistics.
- Open Results.
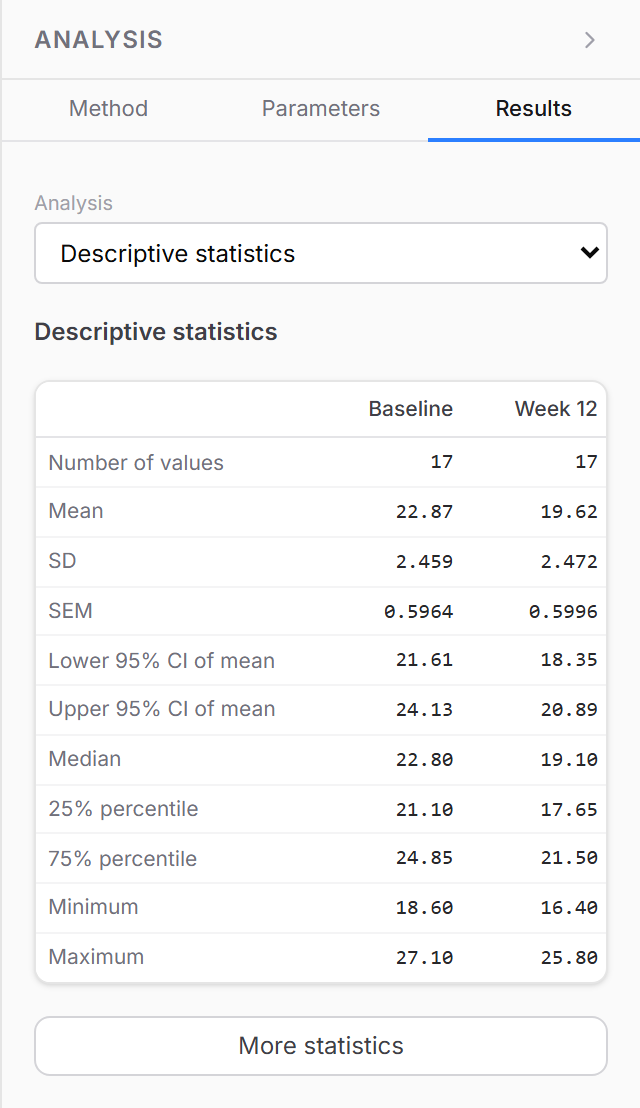
The table lists the number of values, mean, SD, SEM, the 95% CI of the mean, median, quartiles, minimum and maximum for every column. More statistics adds the coefficient of variation, geometric mean, skewness and kurtosis.
Frequently asked questions
Does PivoGraph use n or n − 1 for the SD? n − 1, the sample SD. The SEM and the confidence interval are based on it.
Why is there no error bar on one group? SD and SEM need at least two values. A group with a single value is drawn without an error bar.
Are the numbers accurate? Descriptive statistics, quartiles and percentiles are compared value by value with R on the validation page.