
Make a graph
How to make a Kaplan–Meier survival curve and run a log-rank test
Create a Survival table and enter one row per subject: the time in X, and a code in the column of the subject's group, 1 for an event (such as death) and 0 for a censored subject. PivoGraph draws the Kaplan–Meier curves from these rows. To compare the groups, open the Analysis panel and choose Compare survival curves, which runs the log-rank (Mantel-Cox) and Gehan-Breslow-Wilcoxon tests and reports each group's median survival with its 95% CI, plus a test for trend with three or more curves and the hazard ratio and ratio of medians with two.
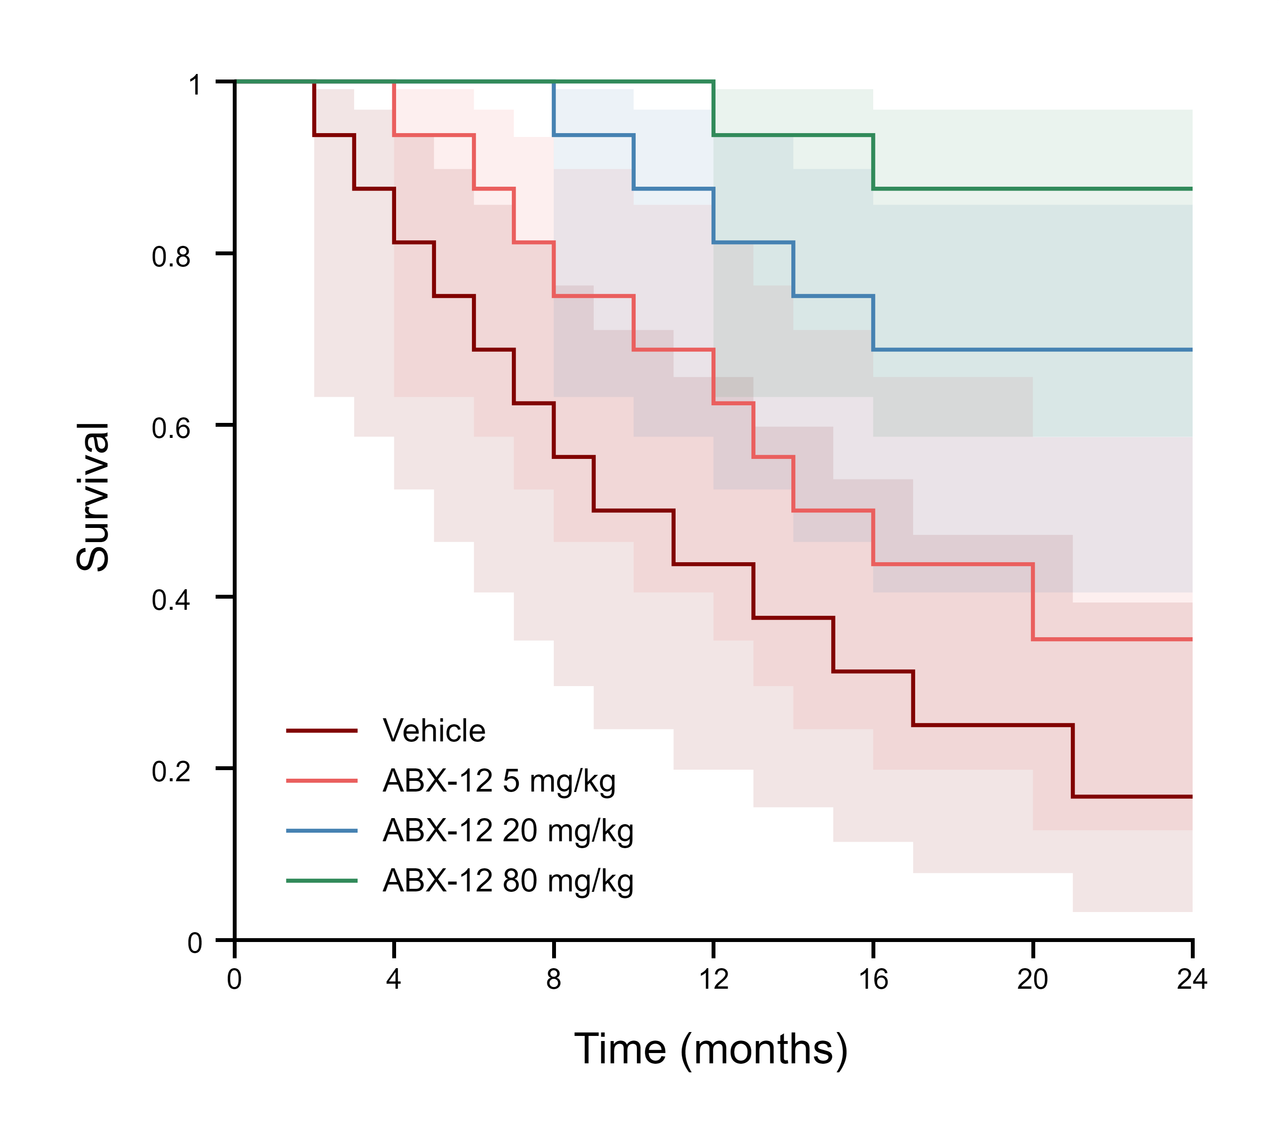
Enter the data
- In the Data Tables sidebar, click Create a new data table, set Table Format to Survival, and click Create.
- Name each column after a group, for example Vehicle and 5 mg/kg.
- Add one row per subject. In X, enter the time until the event or until the subject was last seen. In the subject's group column, enter 1 if the event happened and 0 if the subject was censored. Leave the other groups' cells in that row empty.
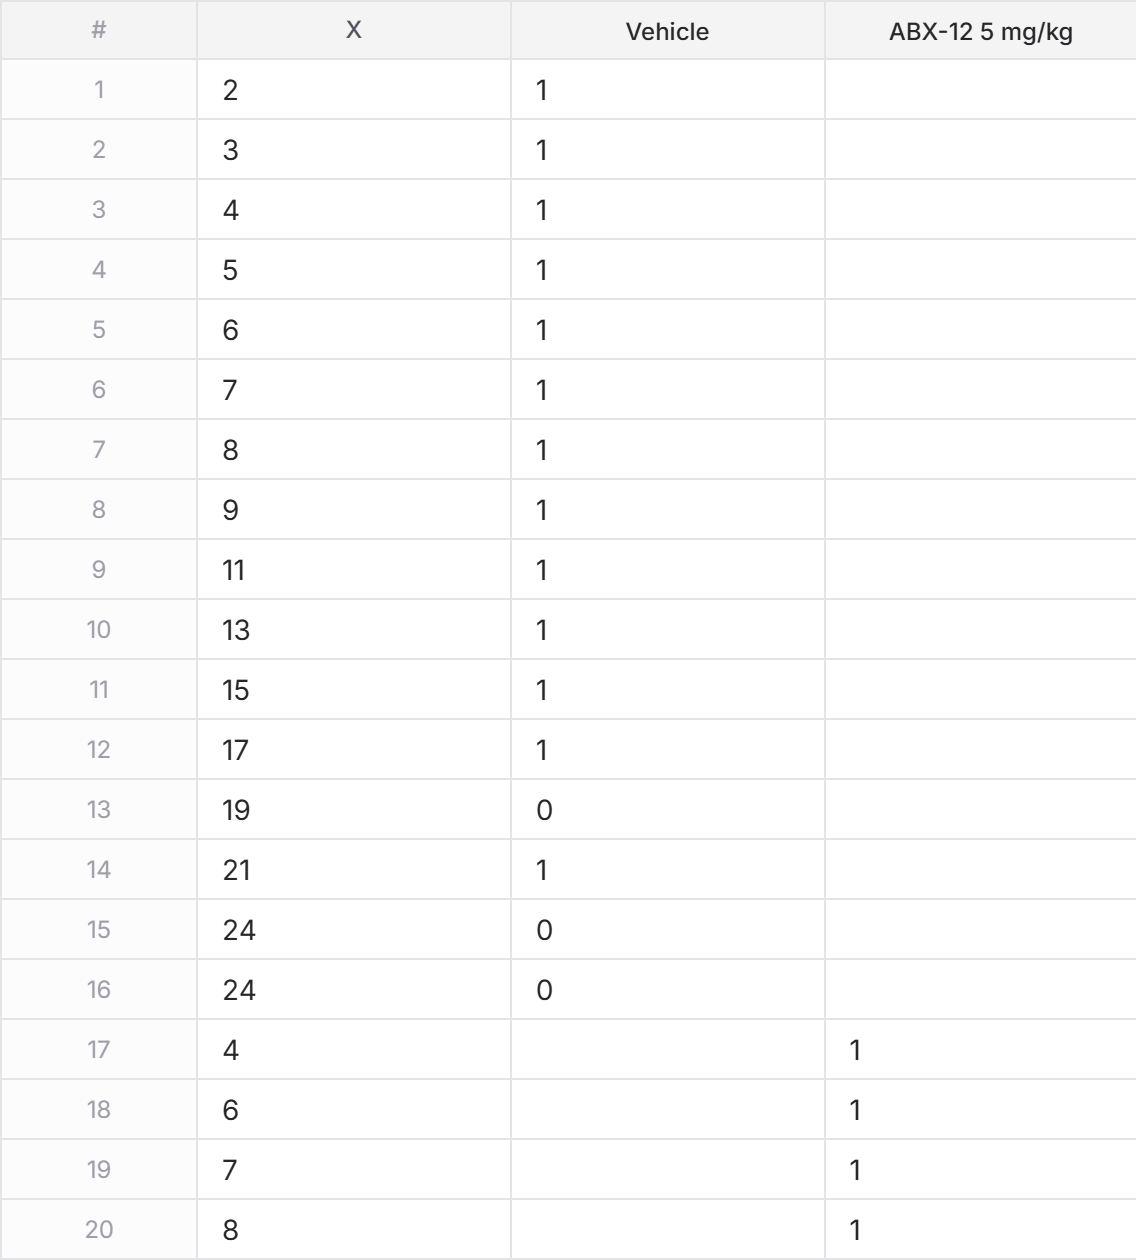
In the sample data, rows 1–16 are the vehicle mice: 13 died (1) and 3 were censored at month 19 or 24 (0). Row 17 starts the 5 mg/kg group. Only 1 and 0 are counted: rows with any other value, or with a missing time or a time of 0 or less, are left out of the calculation, and Results shows how many rows were ignored.
A subject is censored when you know it survived at least until its X time, but not what happened afterwards: it was alive at the end of the study, was lost to follow-up, or left the study for another reason.
Draw the curves
- Switch to Graph View. Under Survival curves you can choose Staircase with ticks, Staircase, points, Point to point or Point to point, error bars.
- In Format Plot, choose what the curve shows (Probability of Survival or Probability of Death), whether to show it as Fractions or Percents, and whether to add Error bars (SE or 95% CI).
- Tick Show number at risk table to print the number of subjects still at risk below the graph.
Compare the curves
- Click Analysis in the panel bar on the right and choose Compare survival curves on Method.
- Open Results.
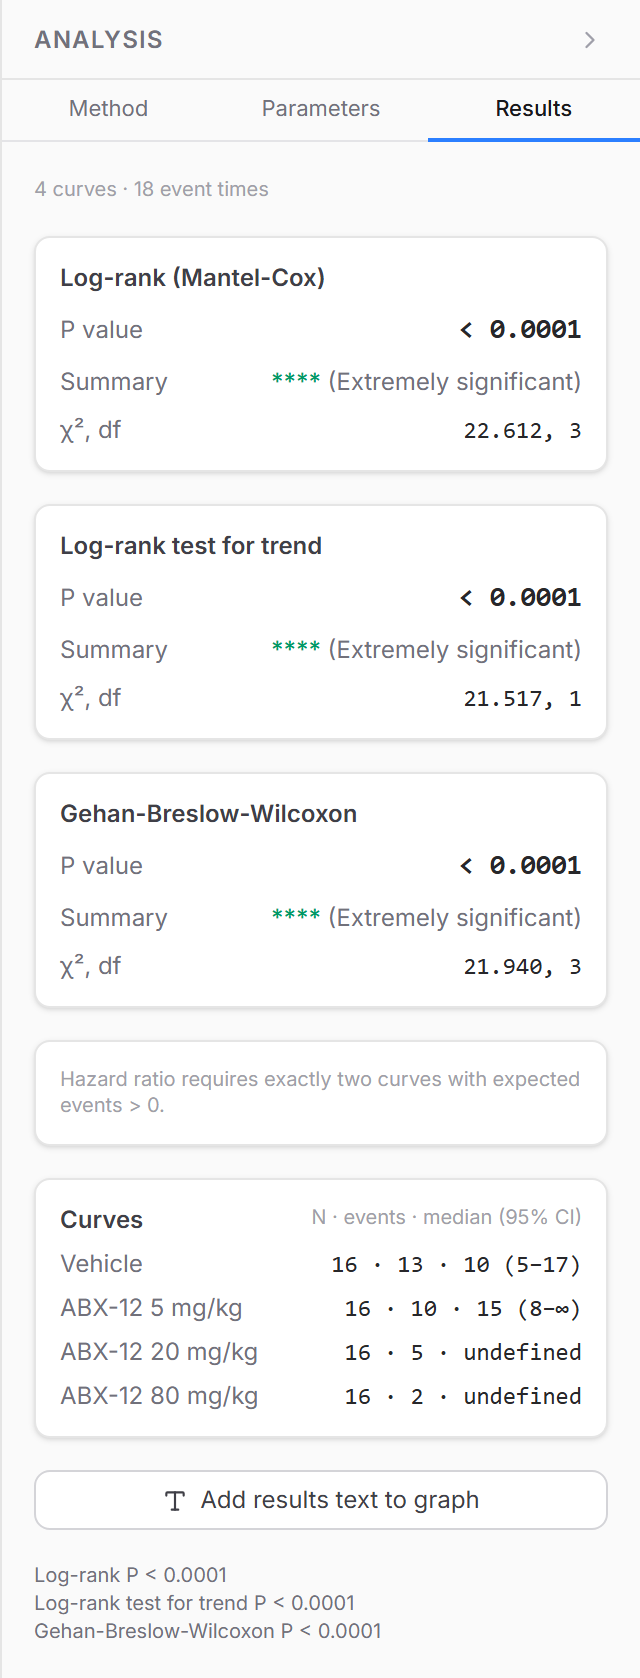
- Log-rank (Mantel-Cox): the standard test of whether the curves differ. Its df is the number of curves minus 1.
- Log-rank test for trend: shown with three or more curves. It scores the groups 1, 2, 3, … in table order and tests whether survival changes steadily along that order, such as from low to high dose, with 1 df.
- Gehan-Breslow-Wilcoxon: gives more weight to early deaths, when more subjects are still at risk.
- Curves: N, number of events and median survival with its 95% CI per group. The median is shown as undefined when fewer than half of the group had the event, and an upper limit the curve never reaches is shown as ∞.
- Hazard ratio with its 95% CI, by the Mantel-Haenszel and log-rank methods, when the table has exactly two curves, together with the Ratio of median survival and its 95% CI.
In the sample data the log-rank test across the four groups gives χ² = 22.61 with 3 df, P < 0.0001, and with the groups ordered by dose the test for trend gives χ² = 21.52, P < 0.0001. Median survival is 10 months for vehicle (95% CI 5–17) and 15 months for 5 mg/kg (lower limit 8, upper limit not reached), and undefined for the two higher doses.
- Click Add results text to graph to place the results on the graph as a text object. Choose its lines on Parameters under Text placed on the graph: P values of the tests, Hazard ratio (two curves only) and Median survival per group, with 95% CI.
Frequently asked questions
Log-rank or Gehan-Breslow-Wilcoxon? Report the log-rank test unless you planned otherwise. It weights every time point equally and is most powerful when the hazard ratio stays roughly constant over time. Gehan-Breslow-Wilcoxon is more sensitive to differences early in the study.
When should I look at the test for trend? When the groups have a natural order, such as increasing doses. The test for trend asks specifically whether survival changes along that order, which makes it more focused than the overall log-rank test. It scores the groups in table order, so put the columns in order first.
Can a time point repeat? Yes. Several subjects can have the same X value, as two vehicle mice at month 24 do in the sample data.
What should the figure legend say? Name the test and give n per group, for example "Kaplan–Meier curves; log-rank (Mantel-Cox) test, n = 16 mice per group".