
Make a graph
How to add significance stars to a graph (t-test or ANOVA)
PivoGraph draws significance brackets from the statistics it calculates: run a t-test (two groups) or a One-way ANOVA (three or more groups) in the Analysis panel, then click Add bracket to graph or Add brackets to graph on the Results tab. The stars come from the P value, and each bracket stays attached to its two groups when you resize or restyle the graph.
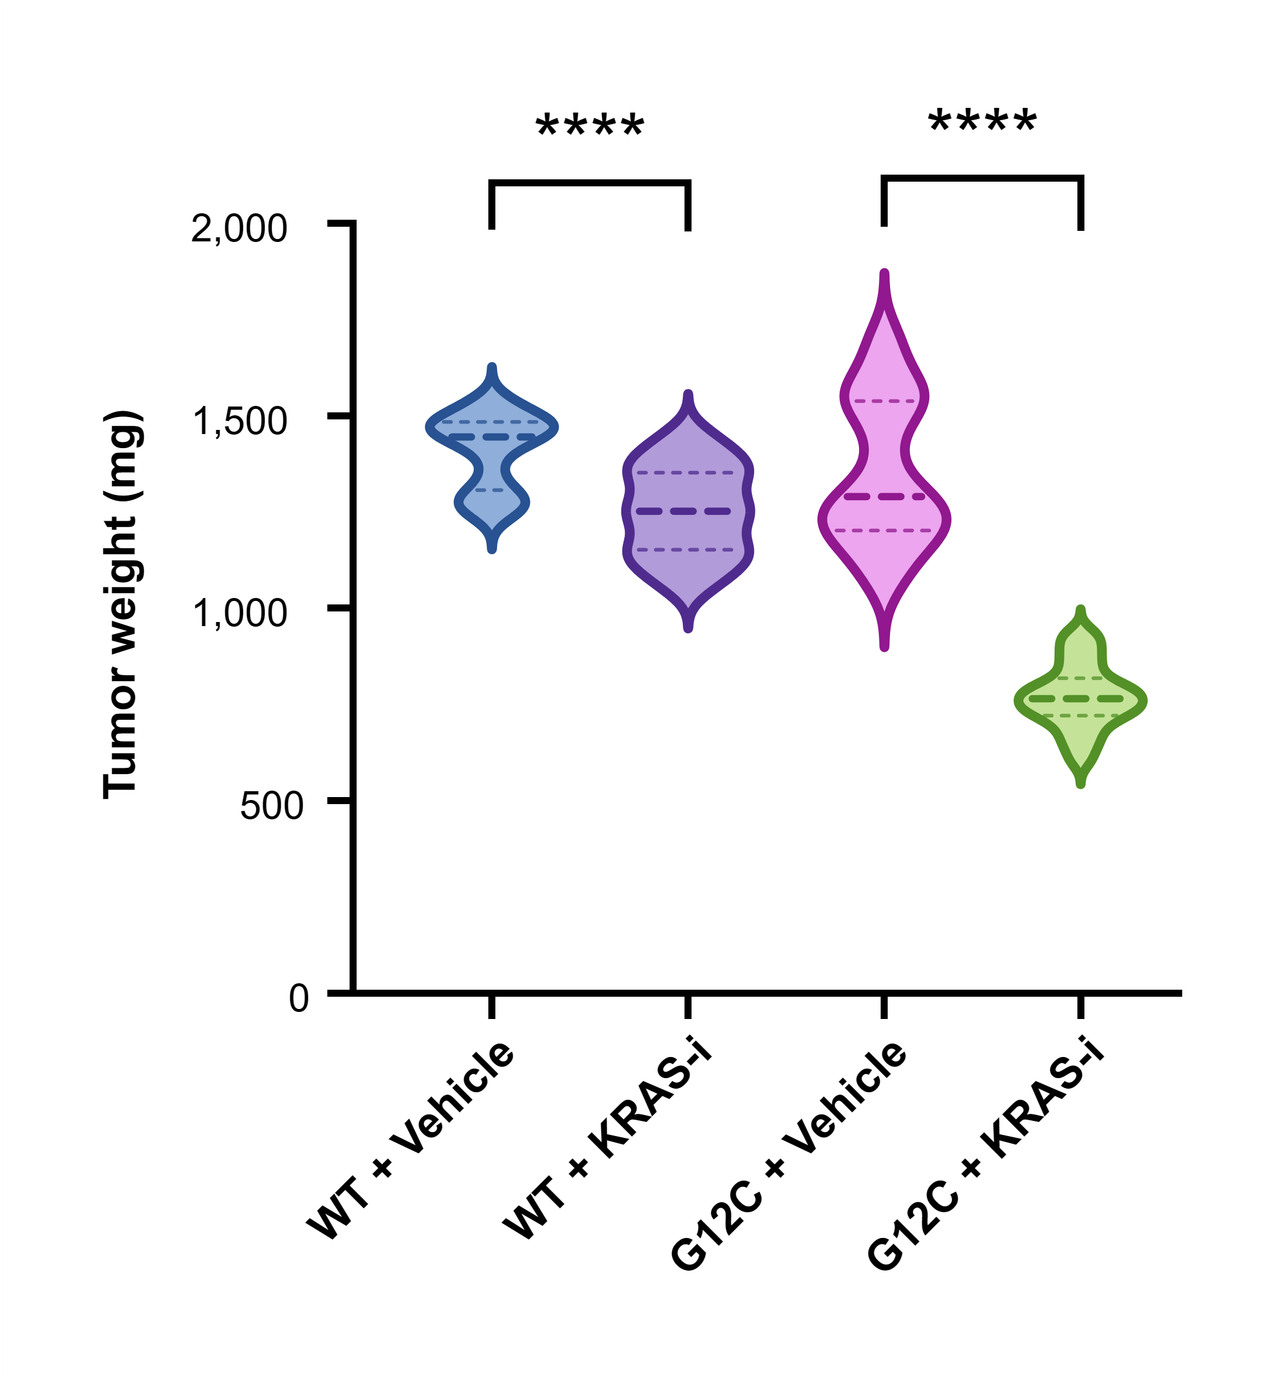
What the stars mean
| Label | P value |
|---|---|
| * | P < 0.05 |
| ** | P < 0.01 |
| *** | P < 0.001 |
| **** | P < 0.0001 |
| ns | Not significant |
For multiple comparisons after a one-way ANOVA, the stars use the adjusted P value (the q value when you control the false discovery rate).
Two groups: t-test or Mann–Whitney test
- Enter the groups as columns of a Column table and switch to Graph View.
- Open the Analysis panel: click Analysis in the panel bar on the right, or choose Analyze → Open Analysis Panel.
- On the Method tab, choose t-test (two groups).
- On the Parameters tab, pick the two groups under Compare, then set:
- Experimental design: Unpaired for independent groups, Paired when the same subjects were measured twice.
- Variance: Welch's t-test, which does not assume equal SDs, or Student's t-test.
- Distribution: Normal (compare means) for a t-test, or Nonparametric (compare ranks) for the Mann–Whitney test (unpaired) or the Wilcoxon matched-pairs signed rank test (paired).
- On the Results tab, read the P value and the effect size, then click Add bracket to graph.
To compare another pair, click Add another to add a second t-test to the same table and repeat the steps.
Three or more groups: one-way ANOVA
- On the Method tab, choose One-way ANOVA (three or more groups) and set the multiple comparisons on Parameters. The one-way ANOVA tutorial explains each choice.
- On the Results tab, click Add brackets to graph. Significant comparisons are drawn as stacked brackets, with the shortest comparisons closest to the data. To show every comparison, tick Also place non-significant (ns) comparisons first.
Clicking the button again updates the stars on brackets that are already on the graph rather than adding new ones.
Fine-tune the brackets
- Drag a bracket to move it; its ends stay attached to the two groups.
- Select a bracket to change its line width, text size or color in Format Object.
- After you change the data, select a bracket and click Fill from analysis to update its stars.
Frequently asked questions
Which P value does a bracket use? The settings of the table's t-test. When the table has a one-way ANOVA and the two groups are part of its comparisons, the bracket uses the adjusted P value from the ANOVA instead.
Should I run several t-tests instead of an ANOVA? For three or more groups, use a one-way ANOVA with a multiple-comparison correction. Repeating t-tests on every pair raises the chance of a false positive.
Can I show the exact P value instead of stars? Yes. Select the bracket and edit its text, for example to "P = 0.003".
Are the P values accurate? The t-tests, rank tests and multiple comparisons are compared value by value with R on the validation page.