
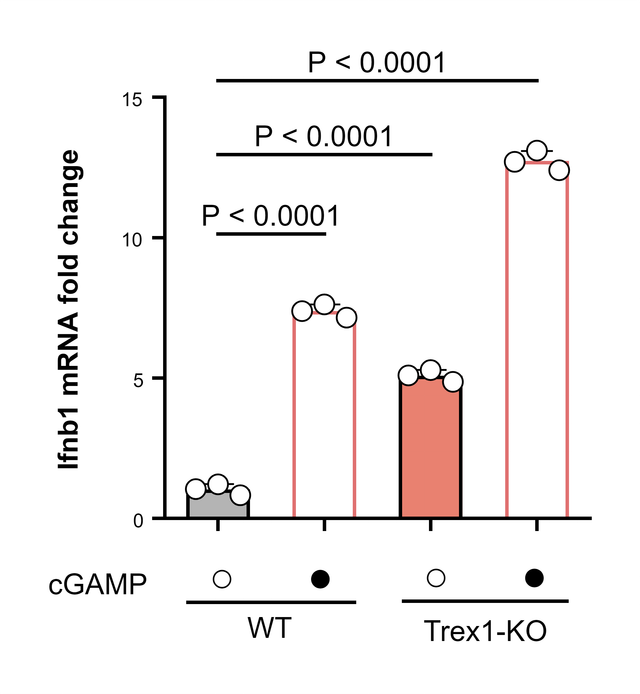
The data you need
A Column table with one group per column and one replicate per row, with the group names in the column titles, such as WT and WT + cGAMP. Groups can have different numbers of values; an error bar needs at least two. Type or paste the values, or import them with File → Import Data (CSV).
What the error bars show
Choose under Plot in Format Plot:
| Option | Error bar |
|---|---|
| Mean with SD | ± standard deviation: how spread out the values are |
| Mean with SEM | ± standard error: how precisely the mean is estimated |
| Mean with 95% CI | The 95% confidence interval of the mean |
The same list also offers the median with its interquartile range, the geometric mean and more. The mean, SD, SEM and confidence interval are compared value by value with R on the validation page.
Bars with every data point
Choose Scatter plot with bar under Individual values to draw each replicate on its bar, the layout many journals recommend for small samples. With Column bar graph you can also tick Symbols in Format Graph to add the points.
What you can adjust
- Bars and boxes and Error bars in Format Graph: the fill and border of the bars, and the color, thickness, cap width and direction of the error bars.
- Flip XY in Format Plot draws horizontal bars.
Statistics on the same graph
Run a t-test for two groups, or a one-way ANOVA with Tukey, Dunnett or other multiple comparisons for more, and place the results above the bars as brackets with stars. See How to add significance stars to a graph and How to run a one-way ANOVA.
Export for a journal
Export the figure as TIFF at 300 to 1200 dpi, or as PDF, EPS or SVG vector artwork; see How to export a 300 dpi TIFF figure for a journal. State in the legend what the error bars show and the sample size, for example "mean ± SD, n = 3 biological replicates".
Frequently asked questions
SD or SEM? SD describes how spread out the values are; SEM describes how precisely the mean is known and shrinks as n grows. See SD vs SEM.
Do I calculate the means myself? No. Enter the raw values; PivoGraph computes the means and error bars and updates them when you edit the data.