
Make a graph
How to make a scatter plot with a regression line and R²
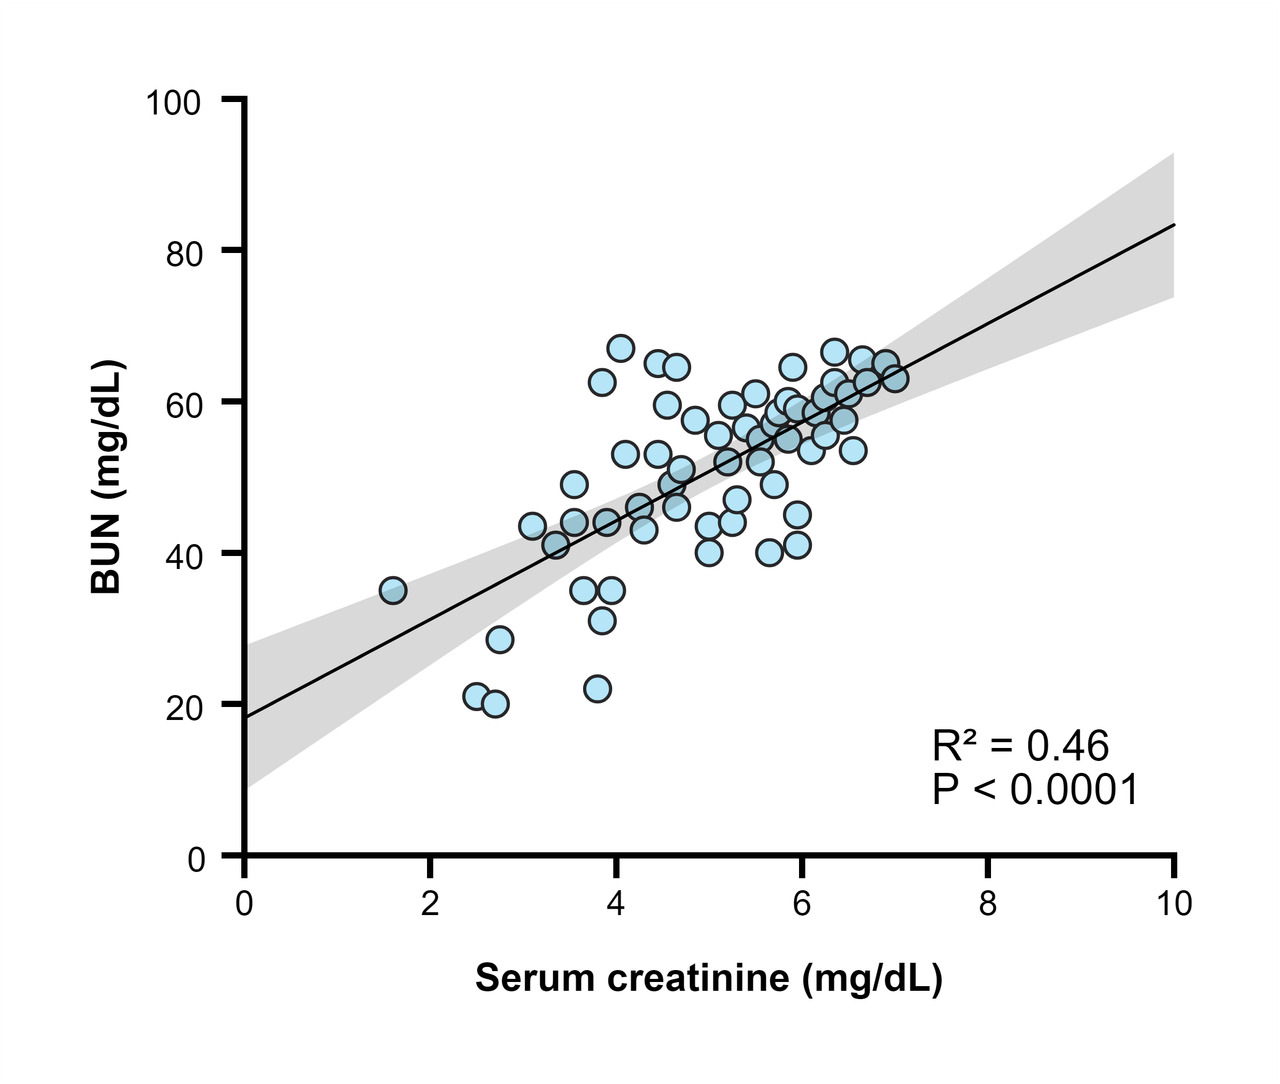
Enter the X and Y values in an XY table and choose Points only in Graph View to get a scatter plot. Then open the Analysis panel and choose Linear regression: PivoGraph draws the fitted line and its 95% confidence band on the graph and reports the slope, Y intercept, R², P value and Sy.x on Results.
Make the scatter plot
- In the Data Tables sidebar, click Create a new data table, set Table Format to XY, and click Create.
- Enter one sample per row: the X variable (for example serum creatinine) in the X column and the Y variable (for example BUN) in the data set next to it.
- Switch to Graph View, click the graph type name above the graph, and choose Points only.
To compare several groups on one graph, enter each group as its own data set. Each data set gets its own symbols and its own regression line.
Add the regression line
- Click Analysis in the panel bar on the right and choose Linear regression on Method.
- On Parameters, keep the Confidence level at 95% or change it.
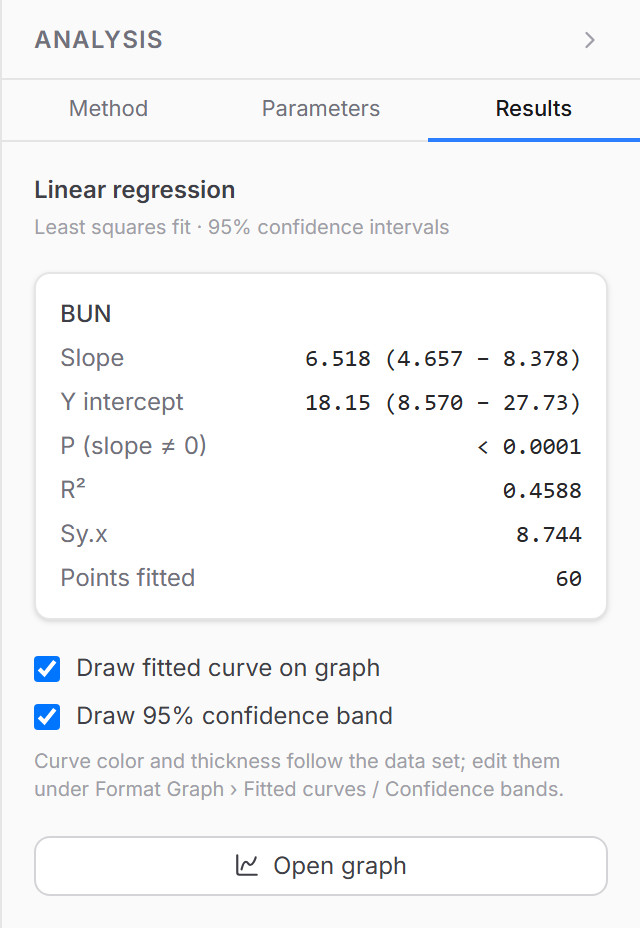
- On Results, keep Draw fitted curve on graph and Draw 95% confidence band ticked.
Read the results
| Result | Meaning | Sample data |
|---|---|---|
| Slope | Change in Y for each unit of X, with its 95% CI | 6.518 (4.657 to 8.378) |
| Y intercept | Value of Y where the line crosses X = 0 | 18.15 |
| P (slope ≠ 0) | Tests whether the slope differs from zero | < 0.0001 |
| R² | Share of the variation in Y explained by the line | 0.4588 |
| Sy.x | Typical vertical distance of the points from the line | 8.744 |
| Points fitted | Number of X–Y pairs used | 60 |
For the sample data the fitted line is Y = 6.518X + 18.15: BUN rises by about 6.5 units for each unit of creatinine, and creatinine explains about 46% of the variation in BUN.
To print the equation and R² on the graph, choose Text in the toolbar above the graph, click where the label should go, and type it, for example Y = 6.52X + 18.2, R² = 0.46.
Style the line
The line and band take the color of their data set. Change their thickness and color under Fitted curves and Confidence bands in Format Graph.
Frequently asked questions
Regression or correlation? Regression describes how Y changes with X and gives an equation for prediction. If you only need the strength of the association, choose Correlation (X vs. Y) on the Analysis panel: it reports Pearson r with its P value and 95% CI, or Spearman's rank correlation.
What if X has replicate Y values? Each replicate counts as one point in the fit.
My data follow a curve, not a line. For S-shaped dose–response data, fit a four-parameter logistic curve instead; see How to calculate IC50 or EC50.
Is the correlation accurate? Pearson and Spearman correlation are compared value by value with R on the validation page.