
Make a graph
How to make a box plot (box and whisker plot)
A box plot shows the median, the middle half of the data and the overall spread of each group. In PivoGraph, enter each group as a column of a Column table, switch to Graph View, choose Box & whiskers under Box and violin, and set the whiskers under Plot in Format Plot: Min to Max, Tukey, or a percentile range such as 10-90 percentile.
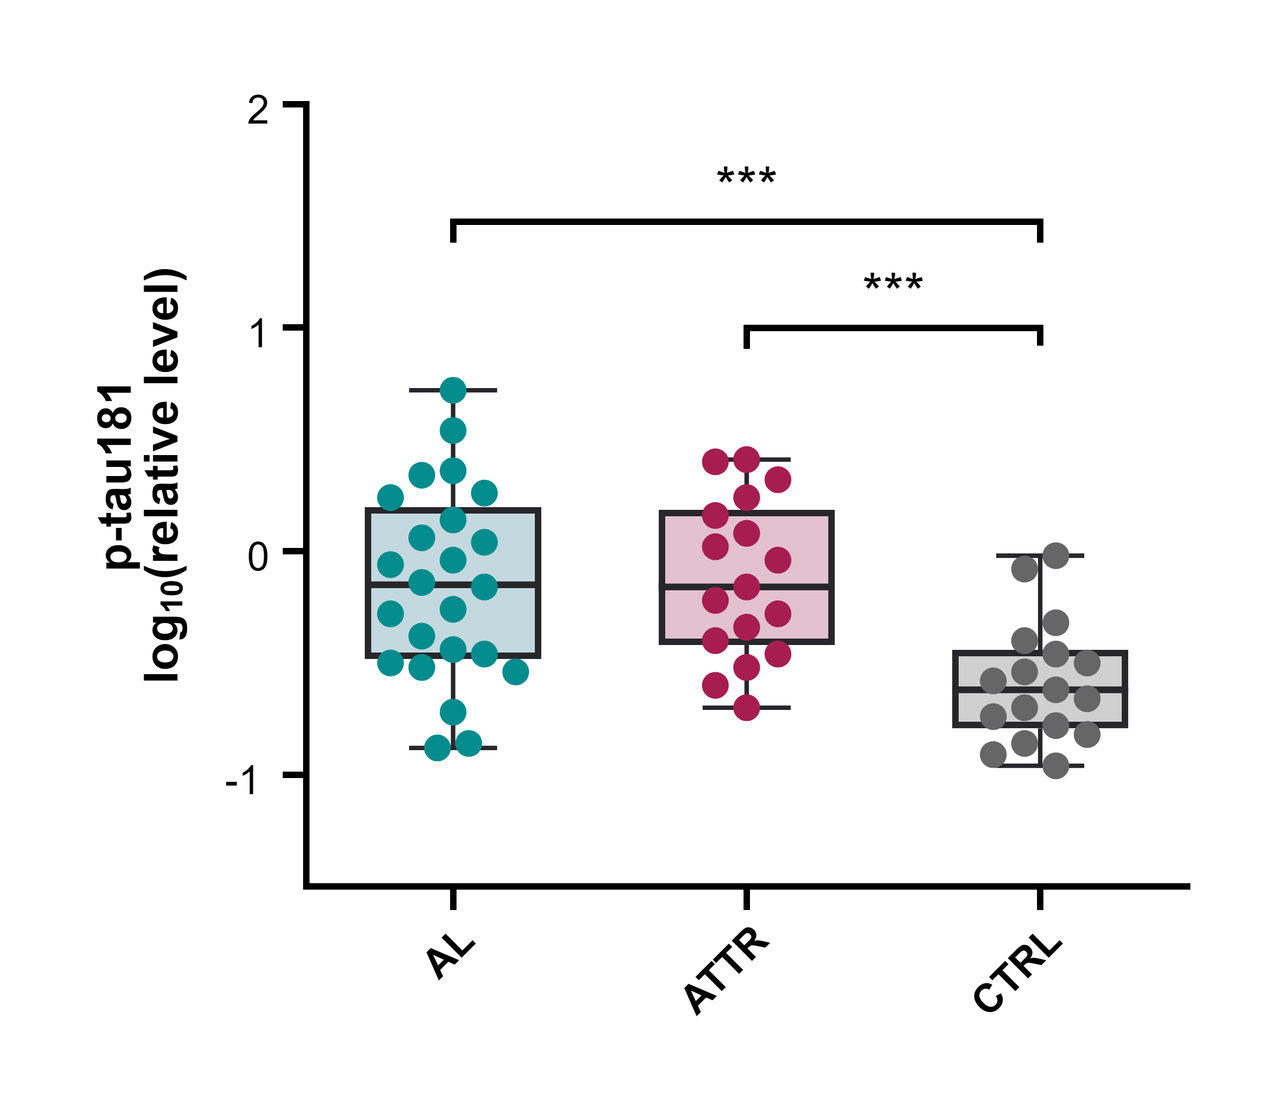
How to read a box plot
- Line inside the box: the median.
- Box: from the 25th to the 75th percentile, so it holds the middle 50% of the values. Its height is the interquartile range (IQR).
- Whiskers: how far they reach depends on the option you choose (see below).
- Points beyond the whiskers: values outside the whisker range, drawn one by one.
PivoGraph calculates quartiles and percentiles with the (n + 1)p rule, the same definition as R's quantile(type = 6).
Make the box plot
- In the Data Tables sidebar, click Create a new data table, set Table Format to Column, and click Create.
- Enter one group per column. Groups can have different numbers of values.
- Switch to Graph View, click the graph type name above the graph, and choose Box & whiskers under Box and violin.
- Click Plot in the panel bar on the right to open Format Plot, and choose the whiskers under Plot.
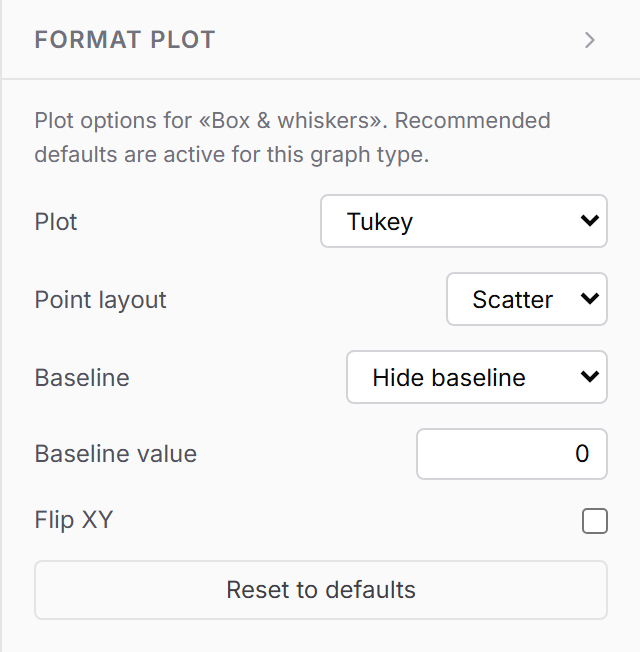
| Option | Whiskers reach | Drawn as separate points |
|---|---|---|
| Min to Max | The smallest and largest value | None |
| Tukey | The most extreme values within 1.5 × IQR of the box | Values more than 1.5 × IQR beyond the box |
| 10-90 percentile (also 5-95, 2.5-97.5, 1-99) | The chosen percentiles | Values outside those percentiles |
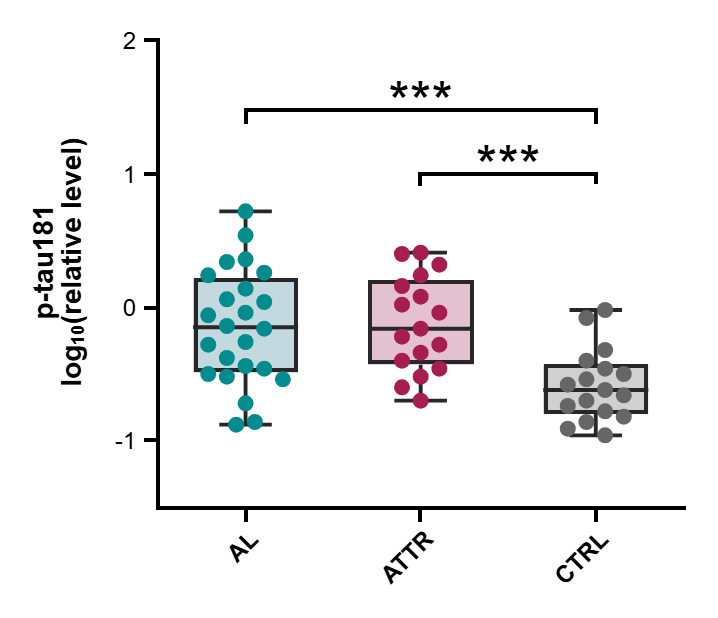
State the whisker definition in the figure legend, for example "boxes show the median and IQR; whiskers extend to the most extreme values within 1.5 × IQR (Tukey)".
Box plot or bar graph?
A bar graph of means summarizes each group with one number and an error bar. A box plot keeps the shape of the distribution visible: skewness, unequal spread and outliers. It suits larger groups and data that are not normally distributed. For a mean-based summary, see How to make a bar graph with error bars.
Frequently asked questions
Can I draw the boxes horizontally? Yes. Tick Flip XY in Format Plot.
How do I change box colors and point style? Use Format Graph: Bars and boxes for the boxes and Symbols for the data points.
What happens with very small groups? With fewer than four values, the box spans the minimum to the maximum and the line marks the median.
How do I make a violin plot instead? Choose Violin plot in the same Box and violin group.
How do I add significance stars? Run a t-test or one-way ANOVA and place the results as brackets; see How to add significance stars to a graph.
Are the quartiles accurate? Quartiles and percentiles are compared value by value with R on the validation page.