
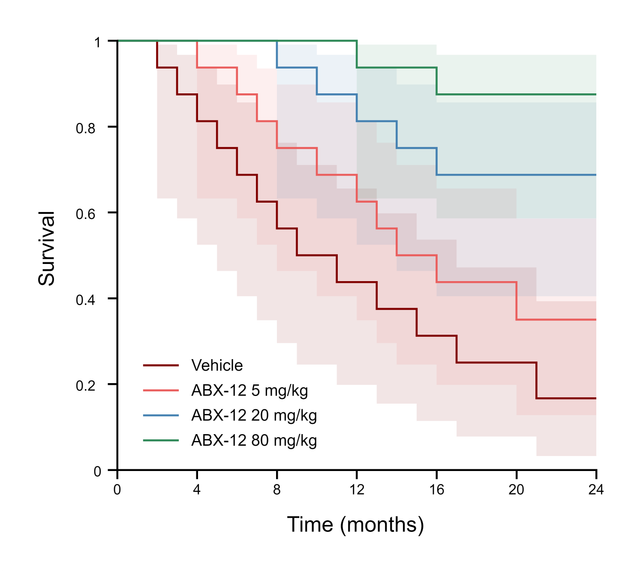
The data you need
A Survival table: the time in X and, in the column of the subject's group, 1 for an event or 0 for a censored subject. Name each column after a group, such as Vehicle and 5 mg/kg. A subject is censored when it was last seen without the event, for example alive at the end of the study or lost to follow-up. Several subjects can share the same time.
What the graph can show
- Four layouts under Survival curves: Staircase with ticks, Staircase, points, Point to point and Point to point, error bars.
- Probability of Survival or Probability of Death, as Fractions or Percents, set in Format Plot.
- Show number at risk table prints the number of subjects still at risk below the graph.
- Censor ticks and Confidence bands in Format Graph style the marks at censored times and add a 95% confidence band around each curve.
Compare the curves
Open the Analysis panel and choose Compare survival curves. The results include:
- The Log-rank (Mantel-Cox) and Gehan-Breslow-Wilcoxon tests, plus the log-rank test for trend with three or more groups.
- Each group's N, number of events and median survival with its 95% CI.
- With two groups, the hazard ratio and the ratio of median survival, each with its 95% CI.
Add results text to graph places the P values, hazard ratio and medians on the graph. These calculations are compared with R's survival package on the validation page.
Export for a journal
Export the figure as TIFF at up to 1200 dpi, or as PDF, EPS or SVG vector artwork; see How to export a 300 dpi TIFF figure for a journal. Name the test and n per group in the legend, for example "log-rank (Mantel-Cox) test, n = 16 mice per group".
Frequently asked questions
Log-rank or Gehan-Breslow-Wilcoxon? Report the log-rank test unless you planned otherwise. Gehan-Breslow-Wilcoxon gives more weight to early events, when more subjects are still at risk.
Why is a median survival undefined? When fewer than half of a group had the event, the curve never falls to 50%, so the median cannot be read from it.