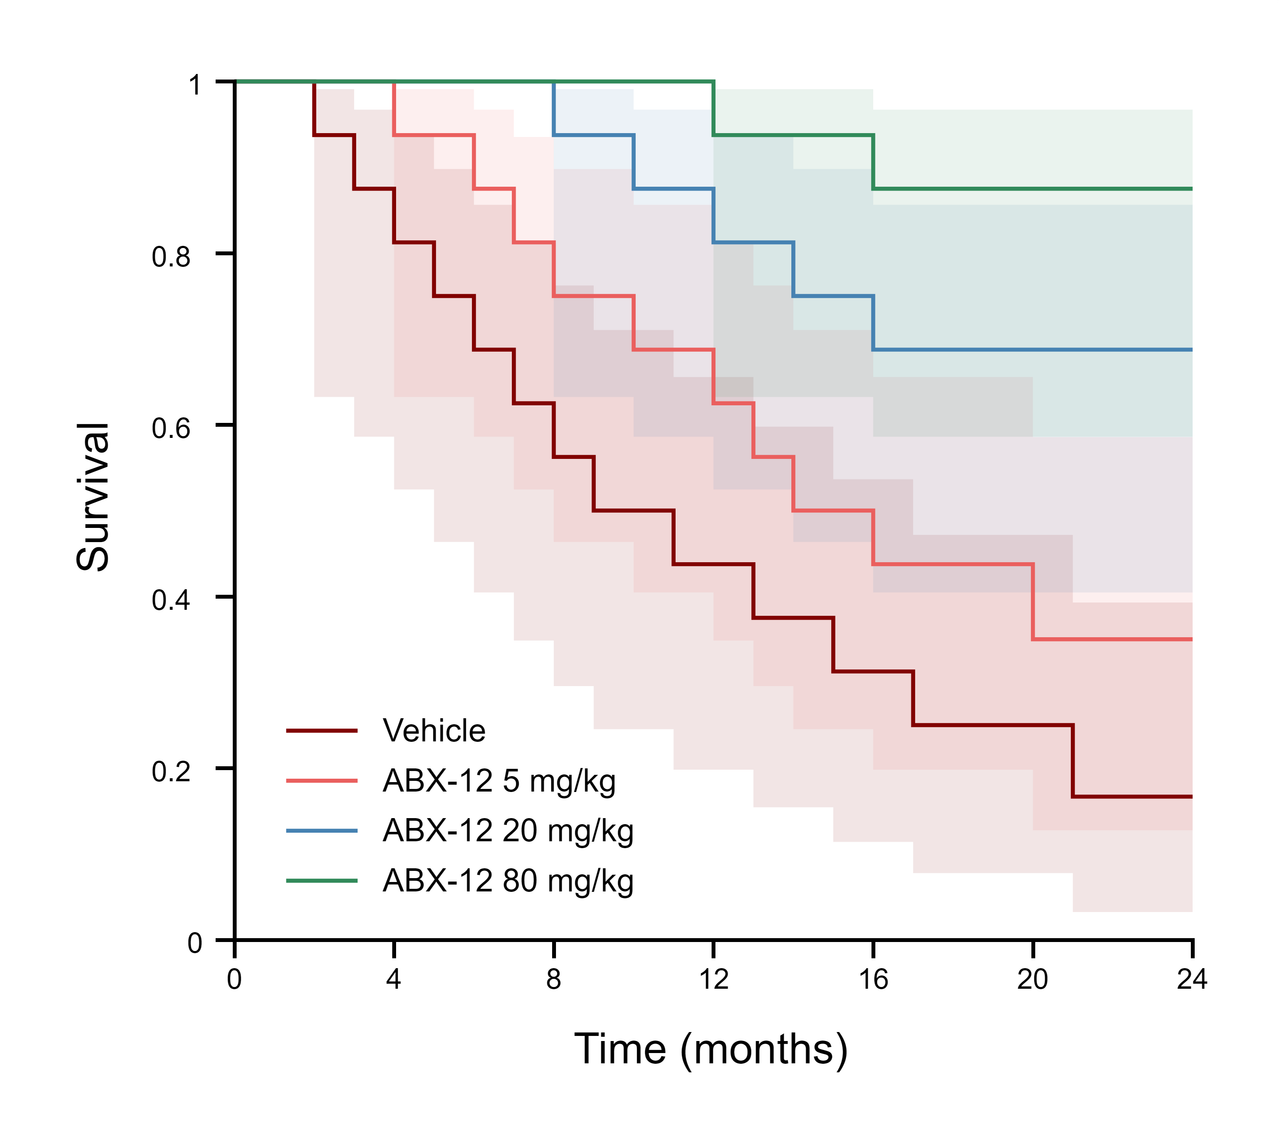
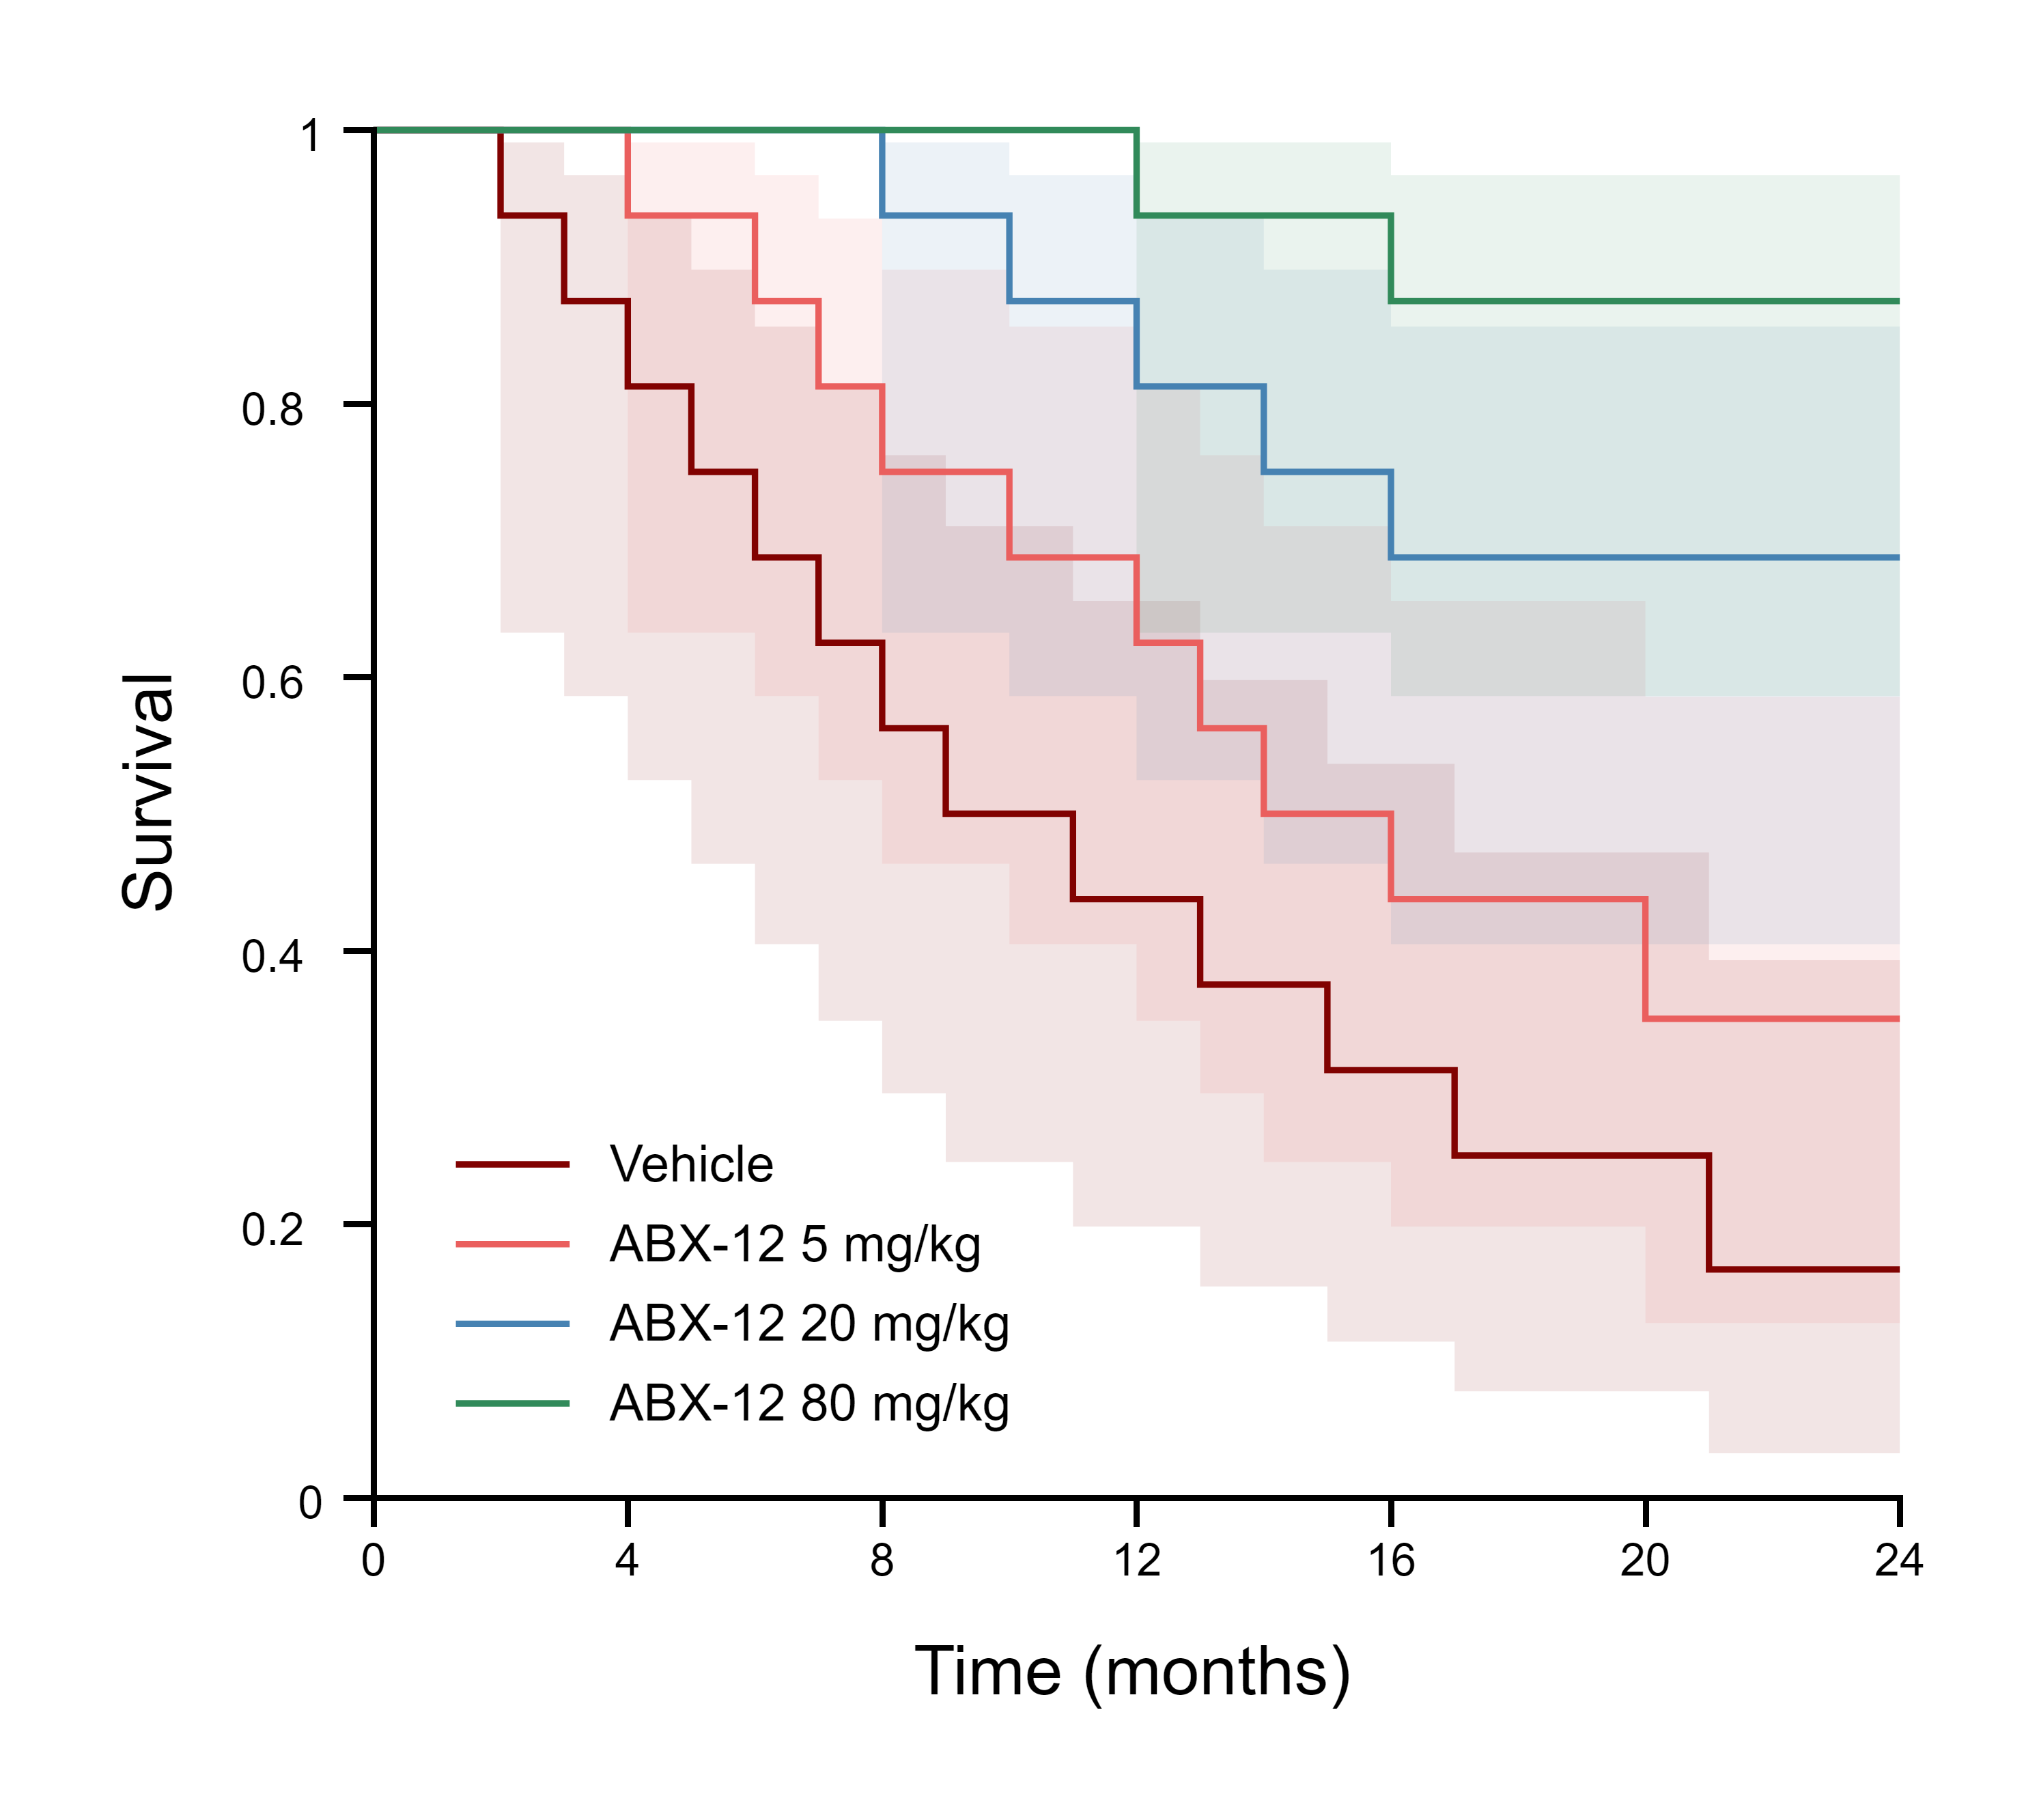
Kaplan–Meier survival for vehicle and three synthetic ABX-12 dose groups, with 16 observations per group and time in months. Staircase curves are accompanied by 95% Greenwood log-log confidence bands.
Kaplan–Meier survival for vehicle and three synthetic ABX-12 dose groups, with 16 observations per group and time in months. Staircase curves are accompanied by 95% Greenwood log-log confidence bands.
This project demonstrates a plotting workflow with synthetic data. The relationships visible in the figure are not research findings.
Design and analysis
Graph type
Staircase, points
Summary and uncertainty
95% CI
Analyses in this project
No statistical analysis is stored in this project.
Data and reuse
Data structure
4 data series · 64 rows · 1 subcolumns per series
Replace with your data
Replace each subject's time and event or censor code in Data View. Keep one data series per cohort; the survival curves and confidence intervals update from those records.