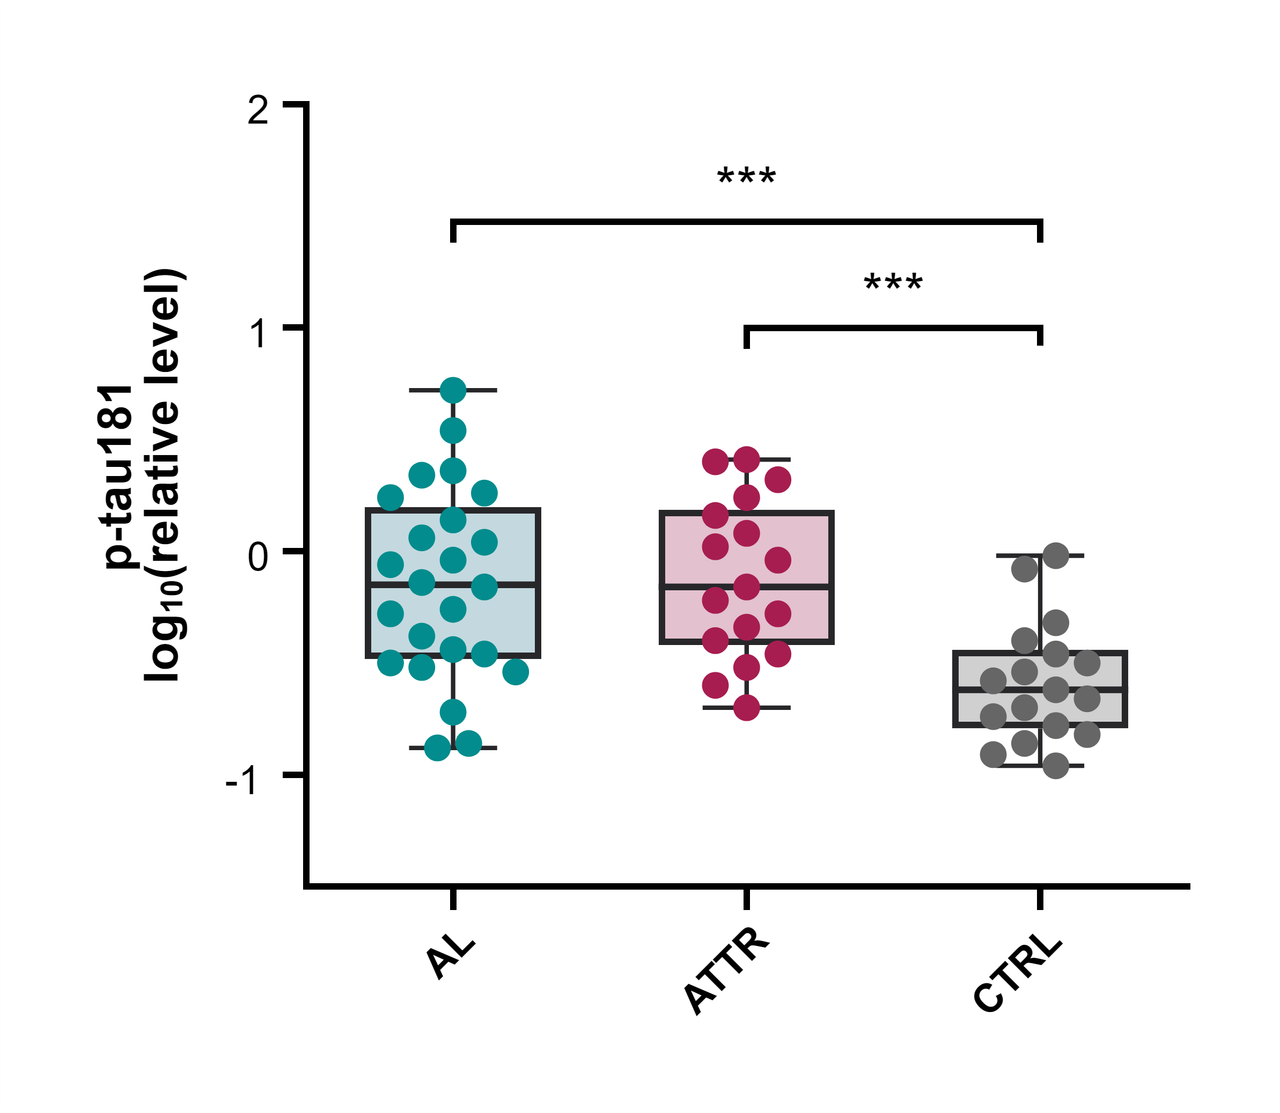
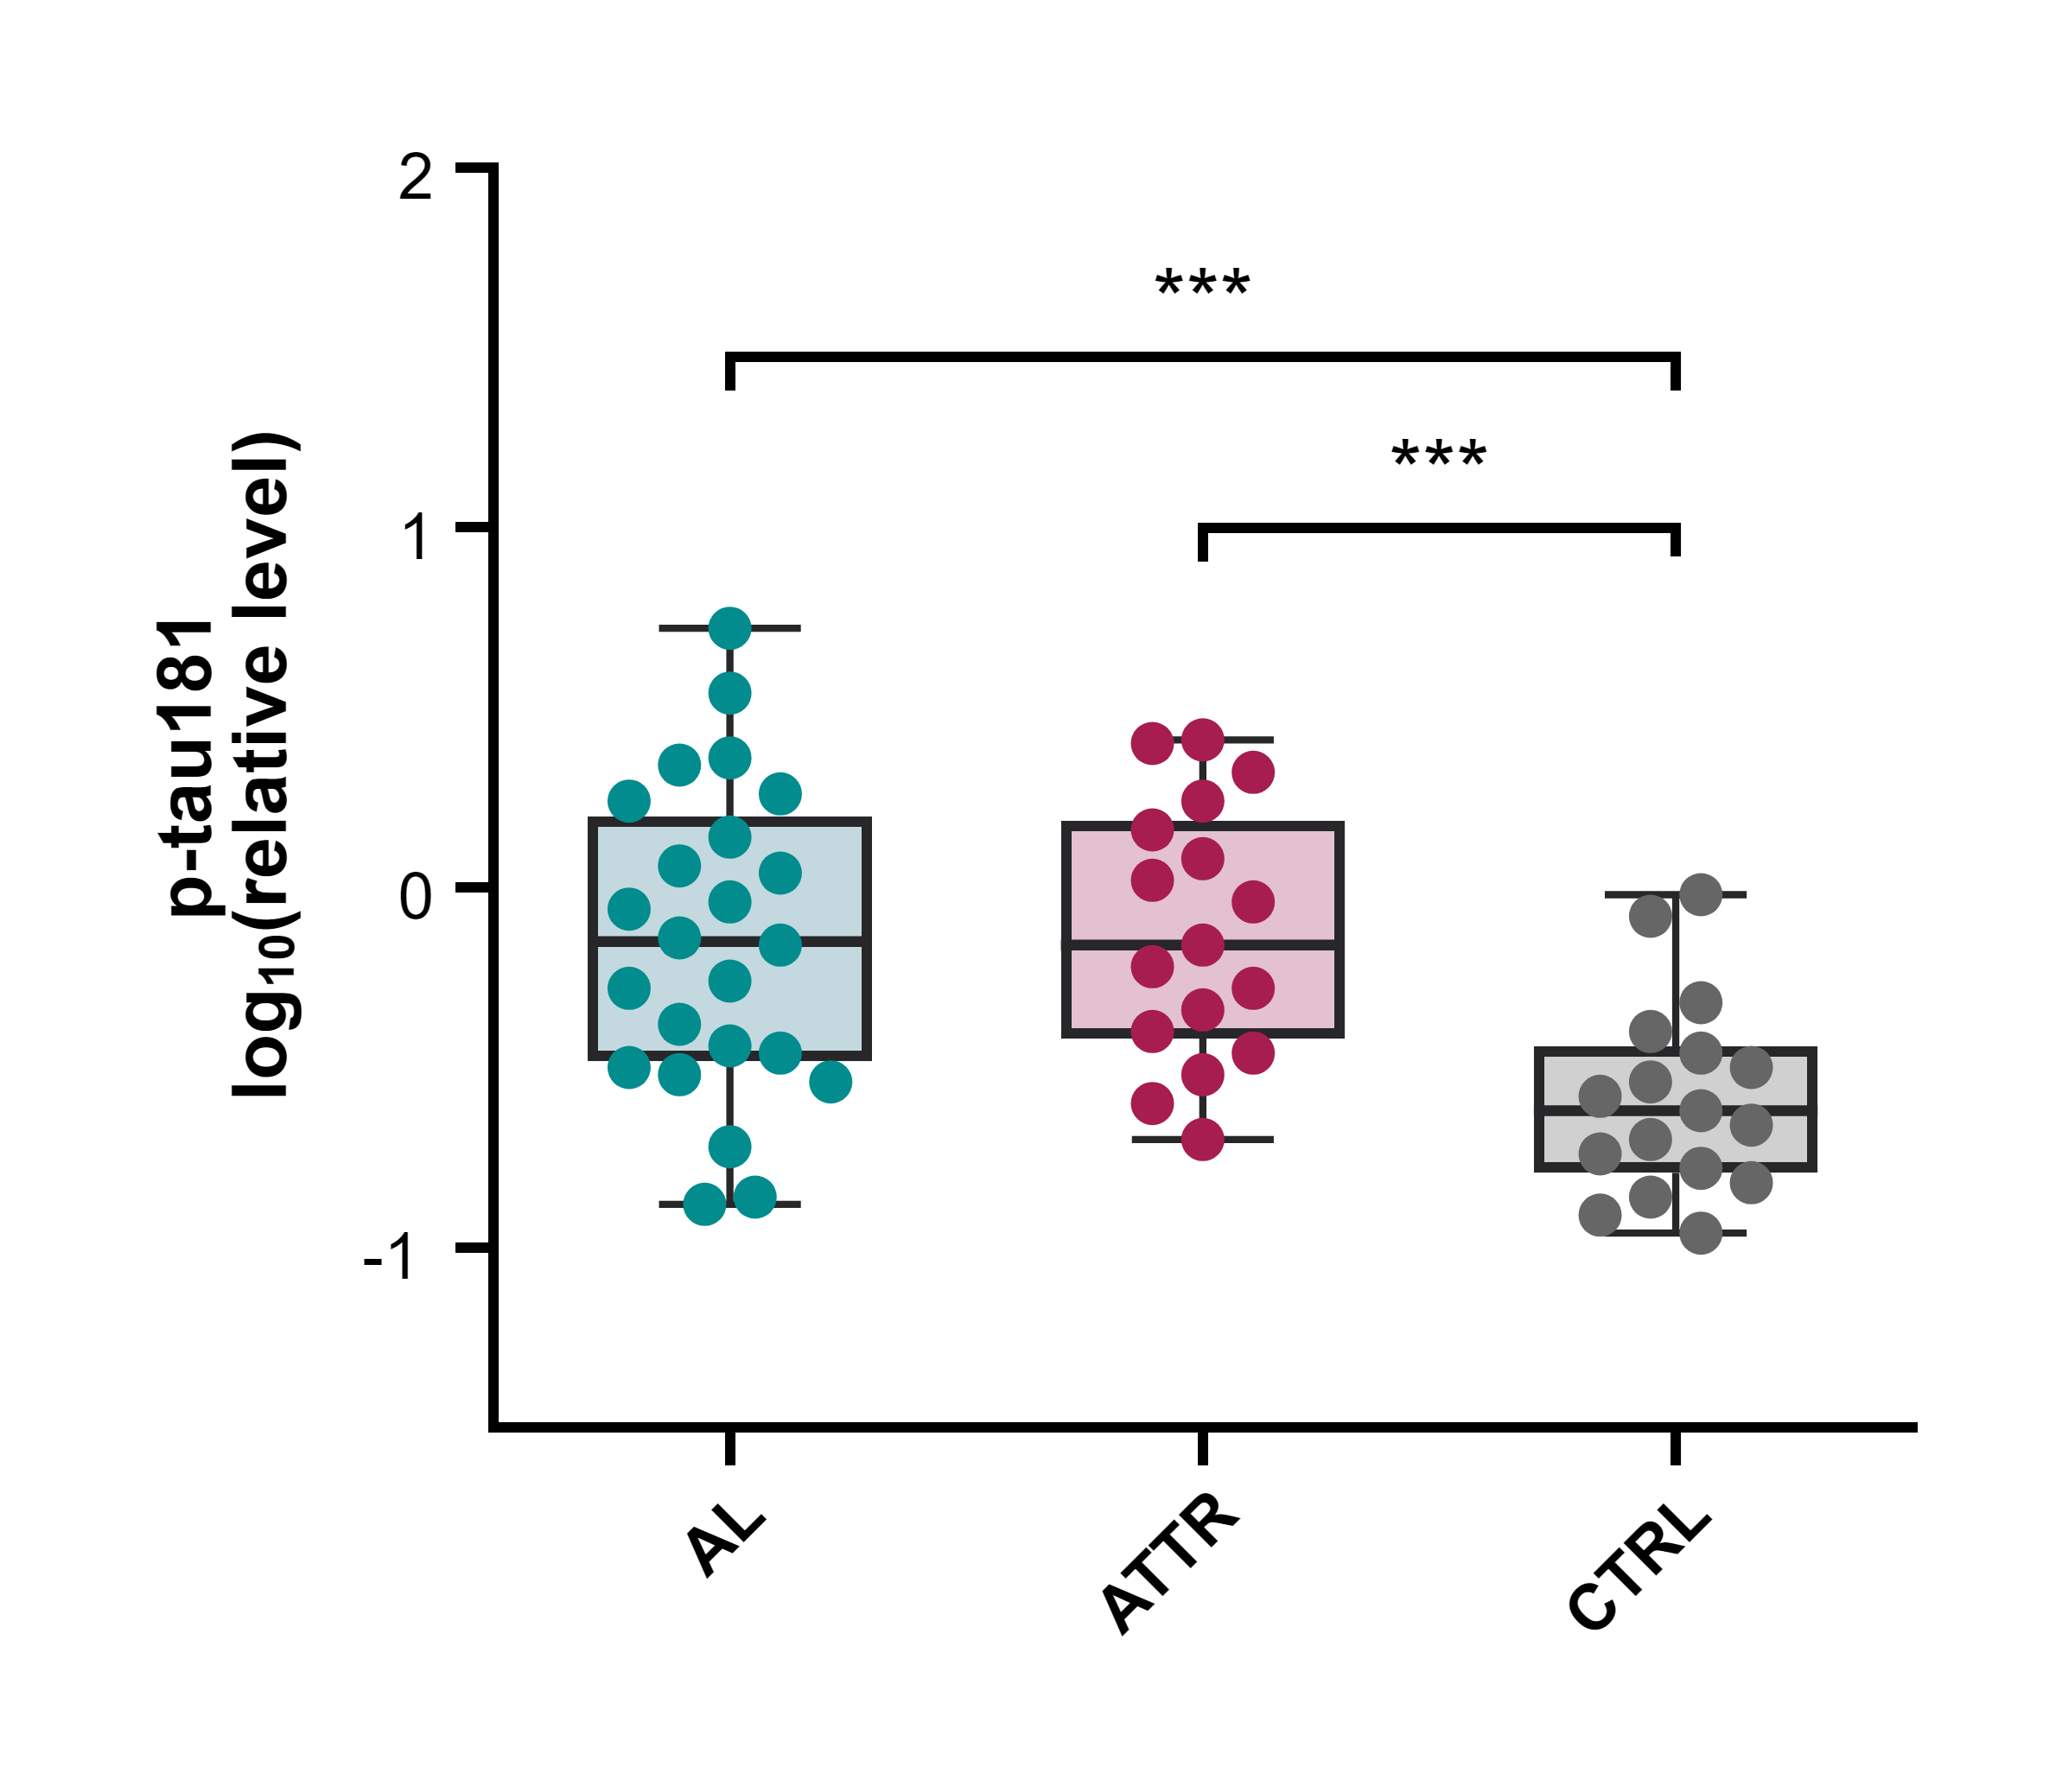
Synthetic log10(p-tau181) values for AL, ATTR, and control cohorts, shown with box-and-whisker summaries and individual observations. The two comparisons against control use Welch's unpaired t-test calculated from this example.
Synthetic log10(p-tau181) values for AL, ATTR, and control cohorts, shown with box-and-whisker summaries and individual observations. The two comparisons against control use Welch's unpaired t-test calculated from this example.
This project demonstrates a plotting workflow with synthetic data. The relationships visible in the figure are not research findings.
Design and analysis
Graph type
Box & whiskers
Analyses in this project
t-test (two groups)
Data and reuse
Data structure
4 data series · 24 rows · 1 subcolumns per series
Replace with your data
Replace the values in each independent group in Data View. Keep or rename the groups as needed; summaries, comparisons, and annotations can then be recalculated from your data.