PivoGraph
Examples Updates Validation Developers About
Language
  • English
  • 中文
Open PivoGraph
← Back to all examples

Relationships & trends

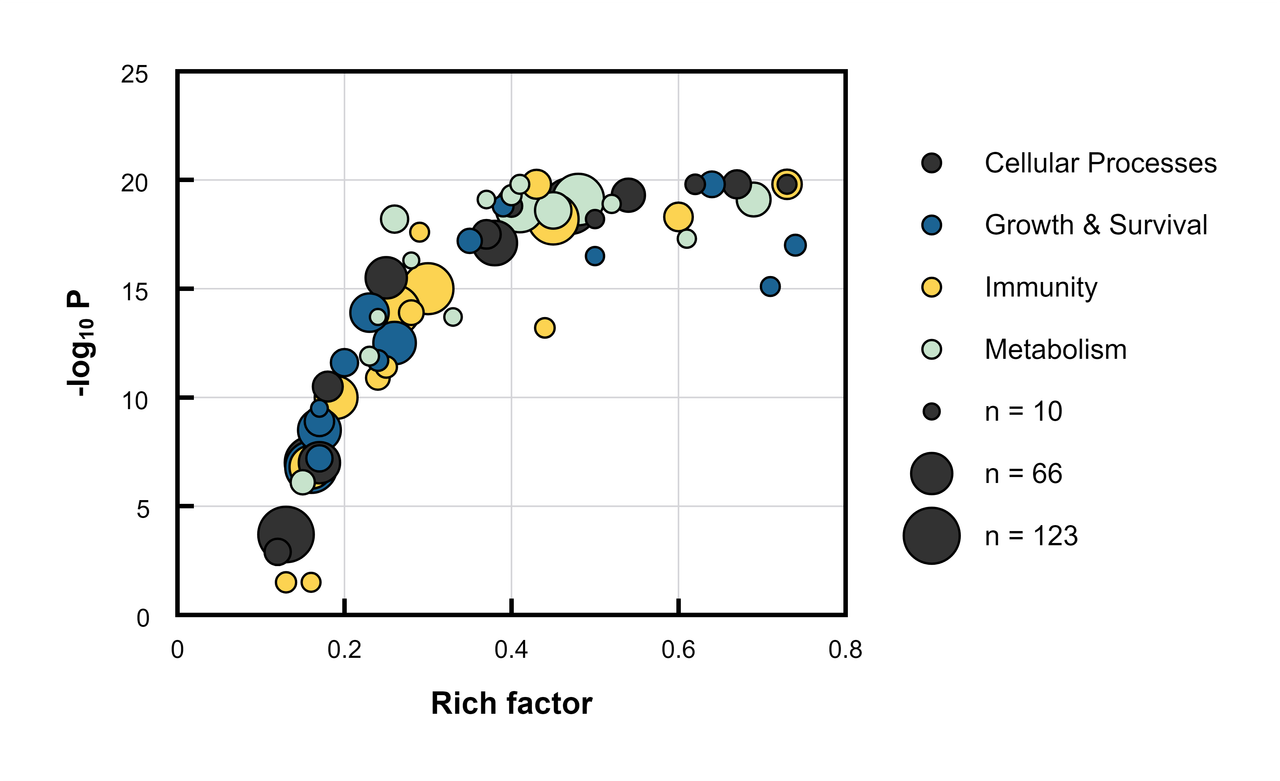
KEGG Pathway Enrichment Bubble Plot

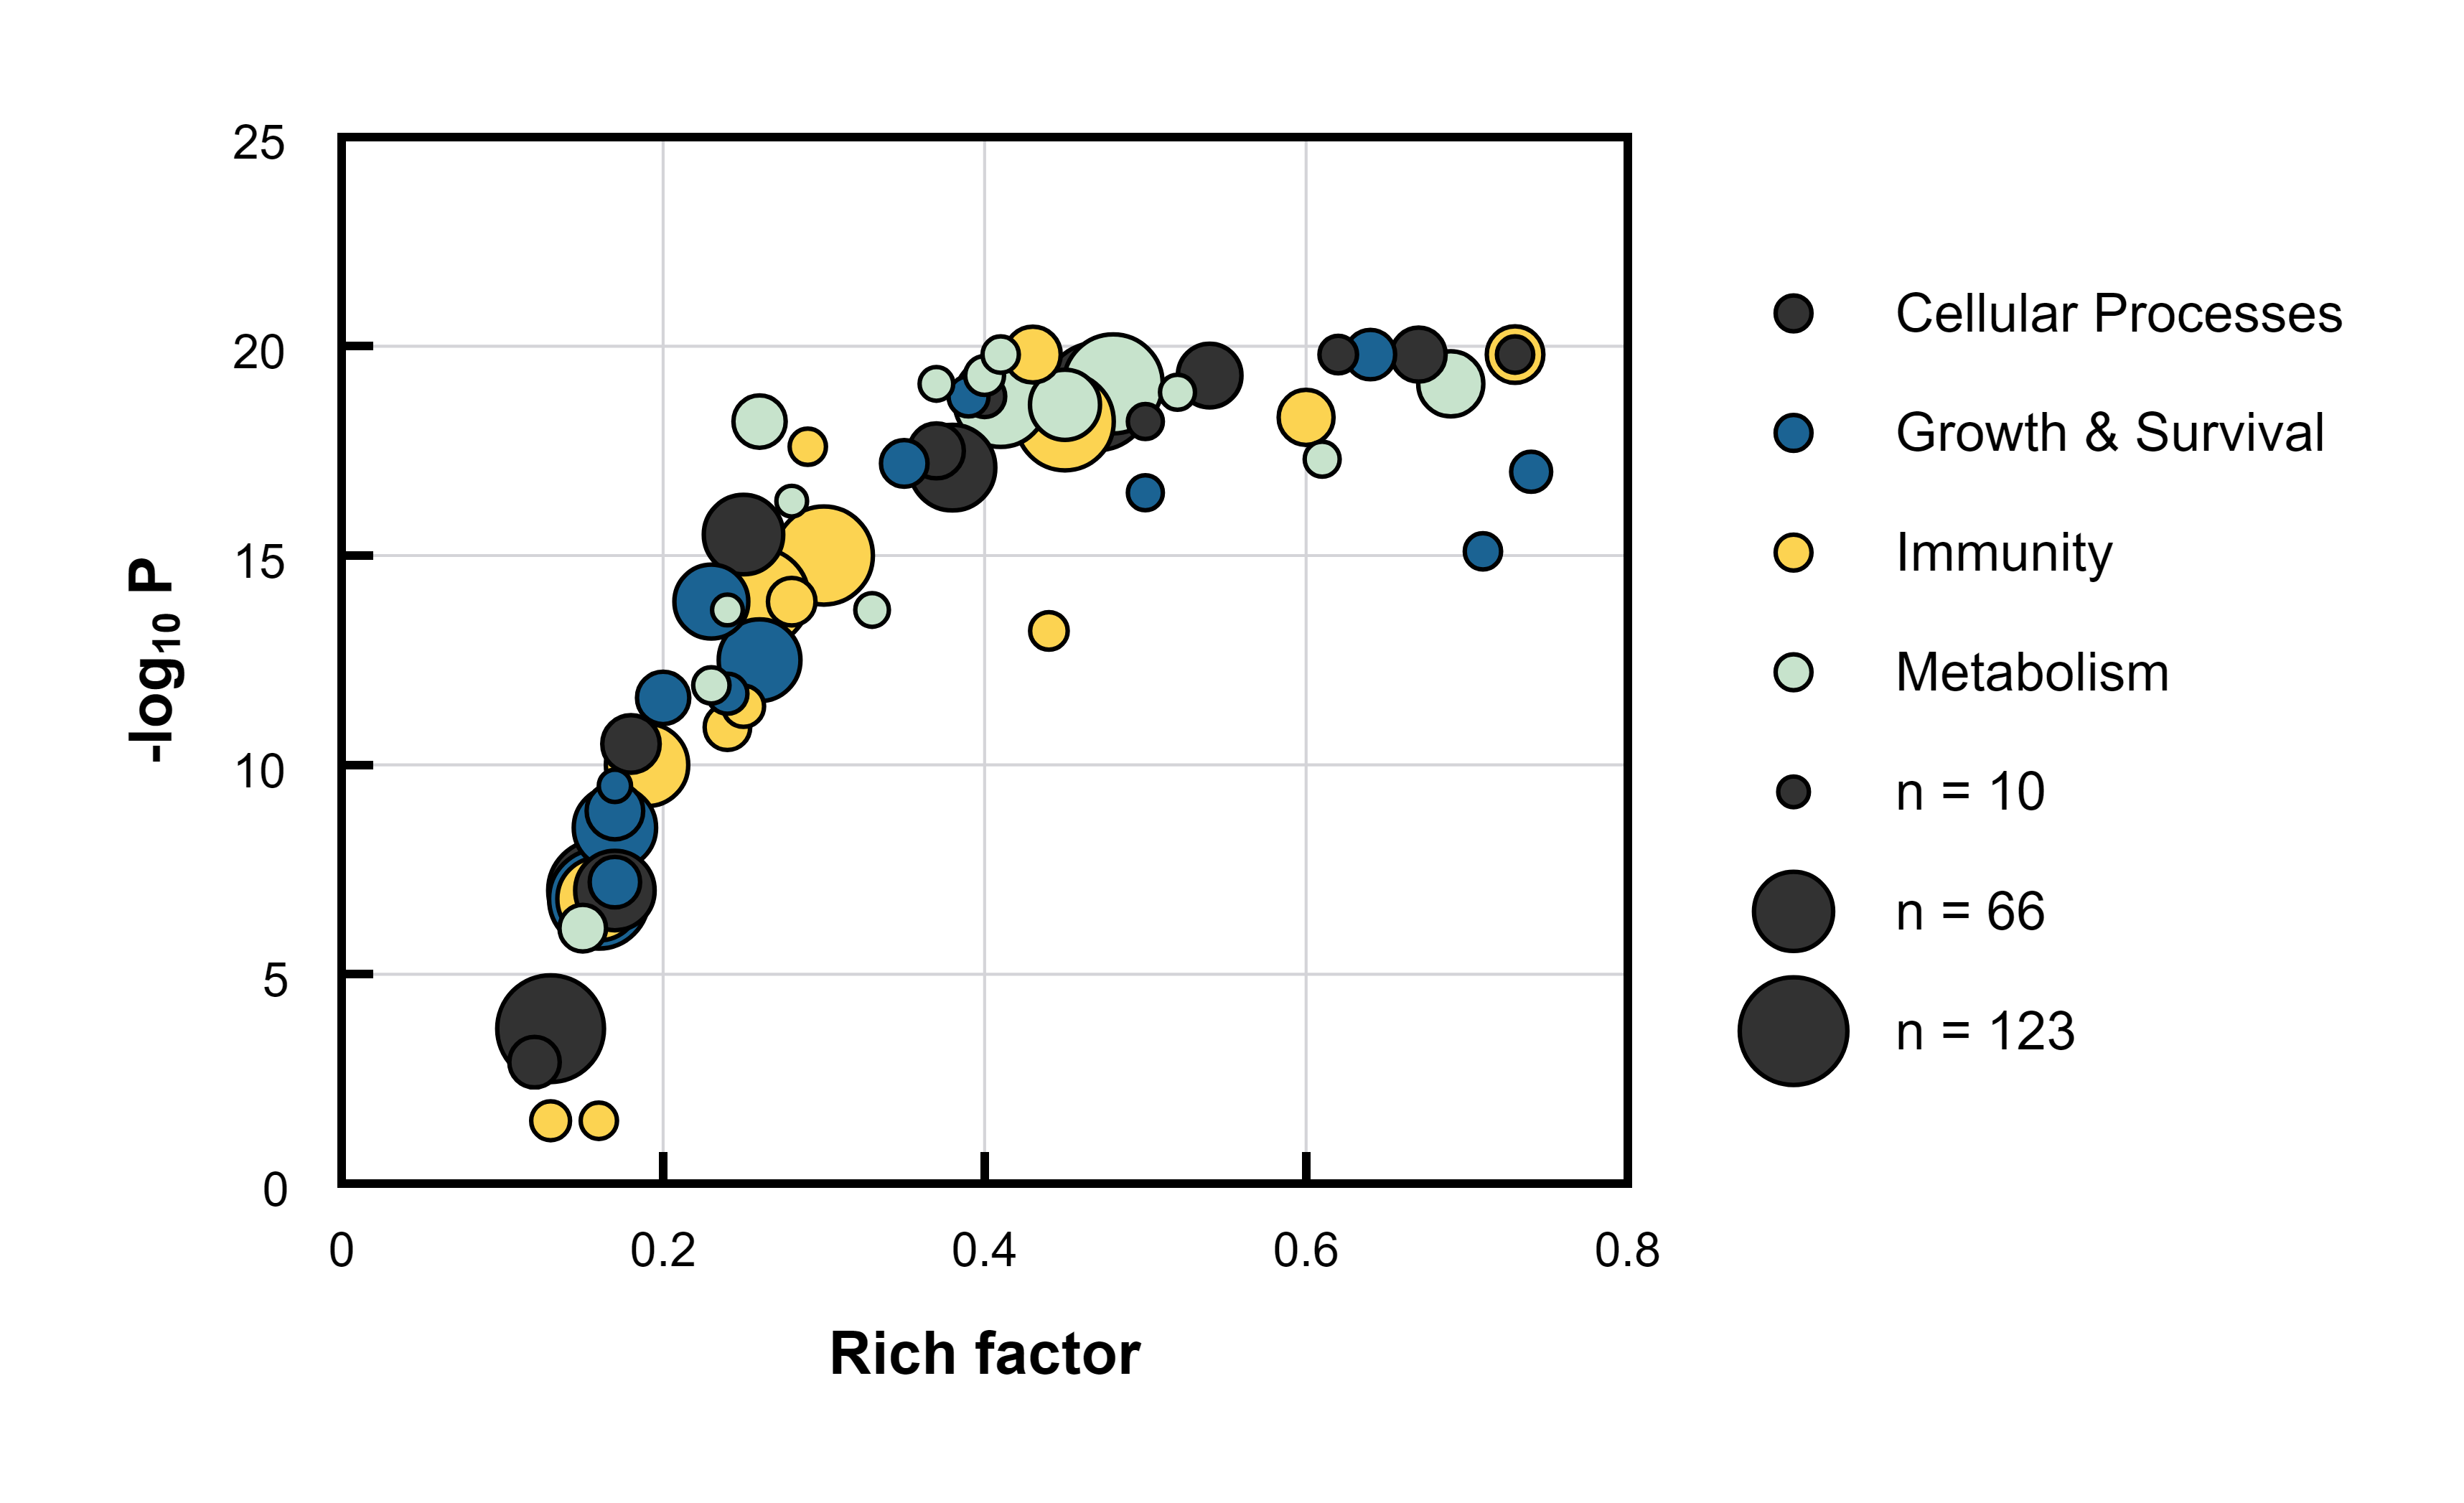
KEGG pathway enrichment for a synthetic set of differentially expressed tumor-cell genes after treatment. Rich factor and −log10 P set position, hit count sets bubble area, and pathway class sets color; size-legend labels are illustrative rounded values.

  • bubble plot
  • pathway enrichment
  • kegg
  • p value
  • size encoding
  • color category
  • omics
  • oncology
Open in PivoGraph Download .pivograph
Graph type
Bubble plot
Summary and uncertainty
Size + color encoding
Data structure
60 observations · 5 variables
KEGG Pathway Enrichment Bubble Plot — Bubble plot · Size + color encoding
Bubble plot · Size + color encoding

About this example

KEGG pathway enrichment for a synthetic set of differentially expressed tumor-cell genes after treatment. Rich factor and −log10 P set position, hit count sets bubble area, and pathway class sets color; size-legend labels are illustrative rounded values.

This project demonstrates a plotting workflow with synthetic data. The relationships visible in the figure are not research findings.

Design and analysis

Graph type
Bubble plot
Summary and uncertainty
Size + color encoding
Analyses in this project

No statistical analysis is stored in this project.

Data and reuse

Data structure
60 observations · 5 variables
Replace with your data
Replace the observation rows while keeping the mapped variable roles for position, size, color, shape, or labels. Review the mapping after changing column names or types.

Data source
Synthetic data generated for this example
License
CC0-1.0

Related editable examples

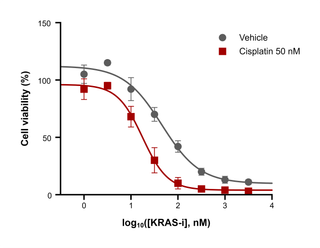
KRAS Inhibitor Dose–Response in Organoids — Points with error bars · 4PL fit

KRAS Inhibitor Dose–Response in Organoids

Points with error bars · 4PL fit

Edit a copy →
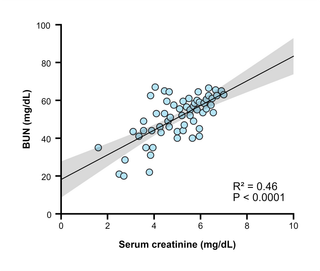
Creatinine and BUN Linear Regression — Points only · Linear regression

Creatinine and BUN Linear Regression

Points only · Linear regression

Edit a copy →
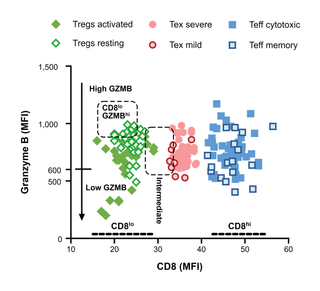
CD8 and Granzyme B across T-Cell Subsets — Points only · Mean ± SD

CD8 and Granzyme B across T-Cell Subsets

Points only · Mean ± SD

Edit a copy →
Privacy Terms Examples Updates Validation About
Language
  • English
  • 中文

© 2026 PivoGraph. All rights reserved.