PivoGraph
Examples Updates Validation Developers About
Language
  • English
  • 中文
Open PivoGraph
← Back to all examples

Composition

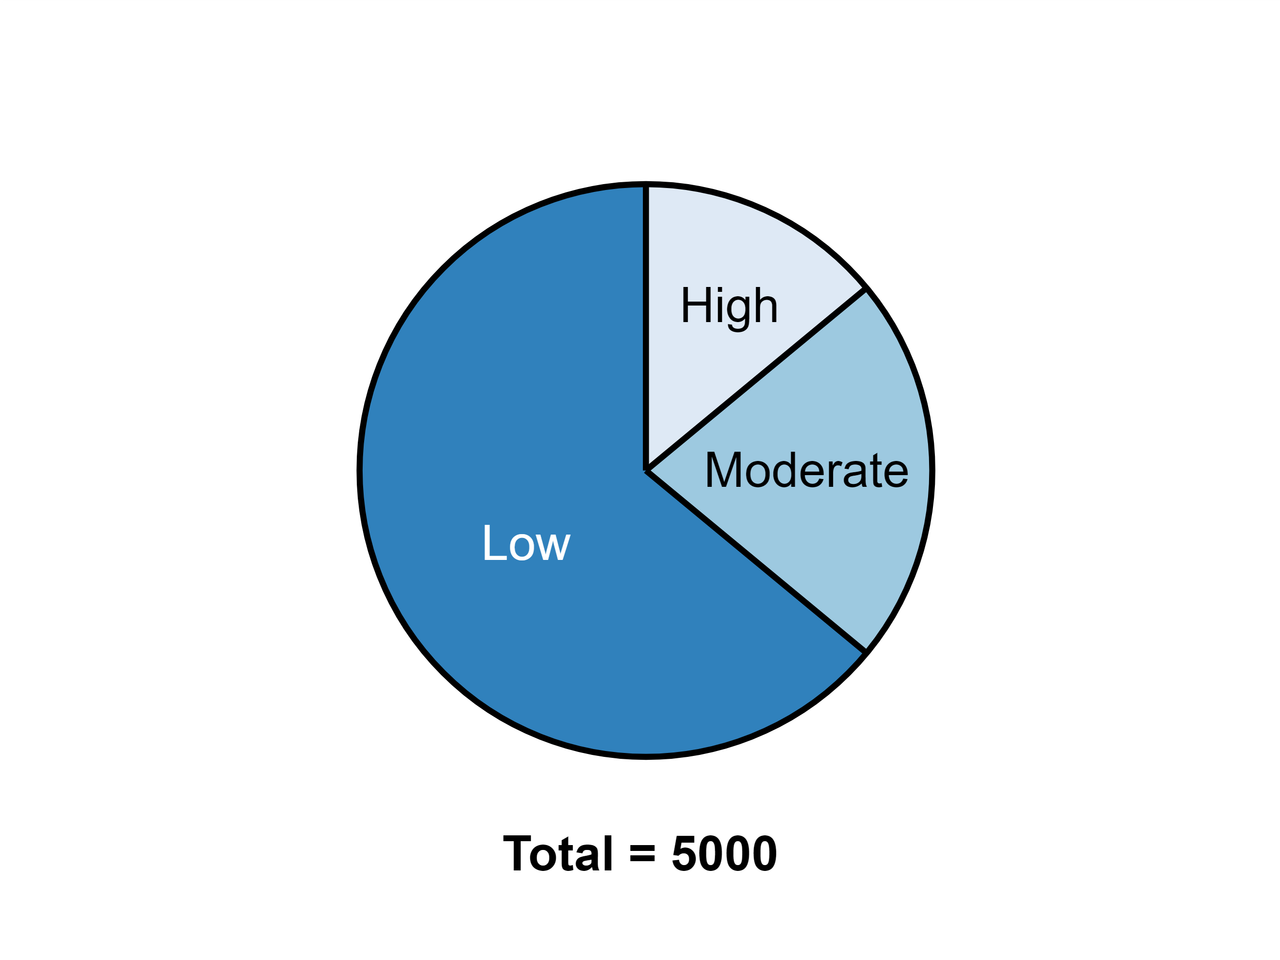
CD8 T-Cell Clone Expansion

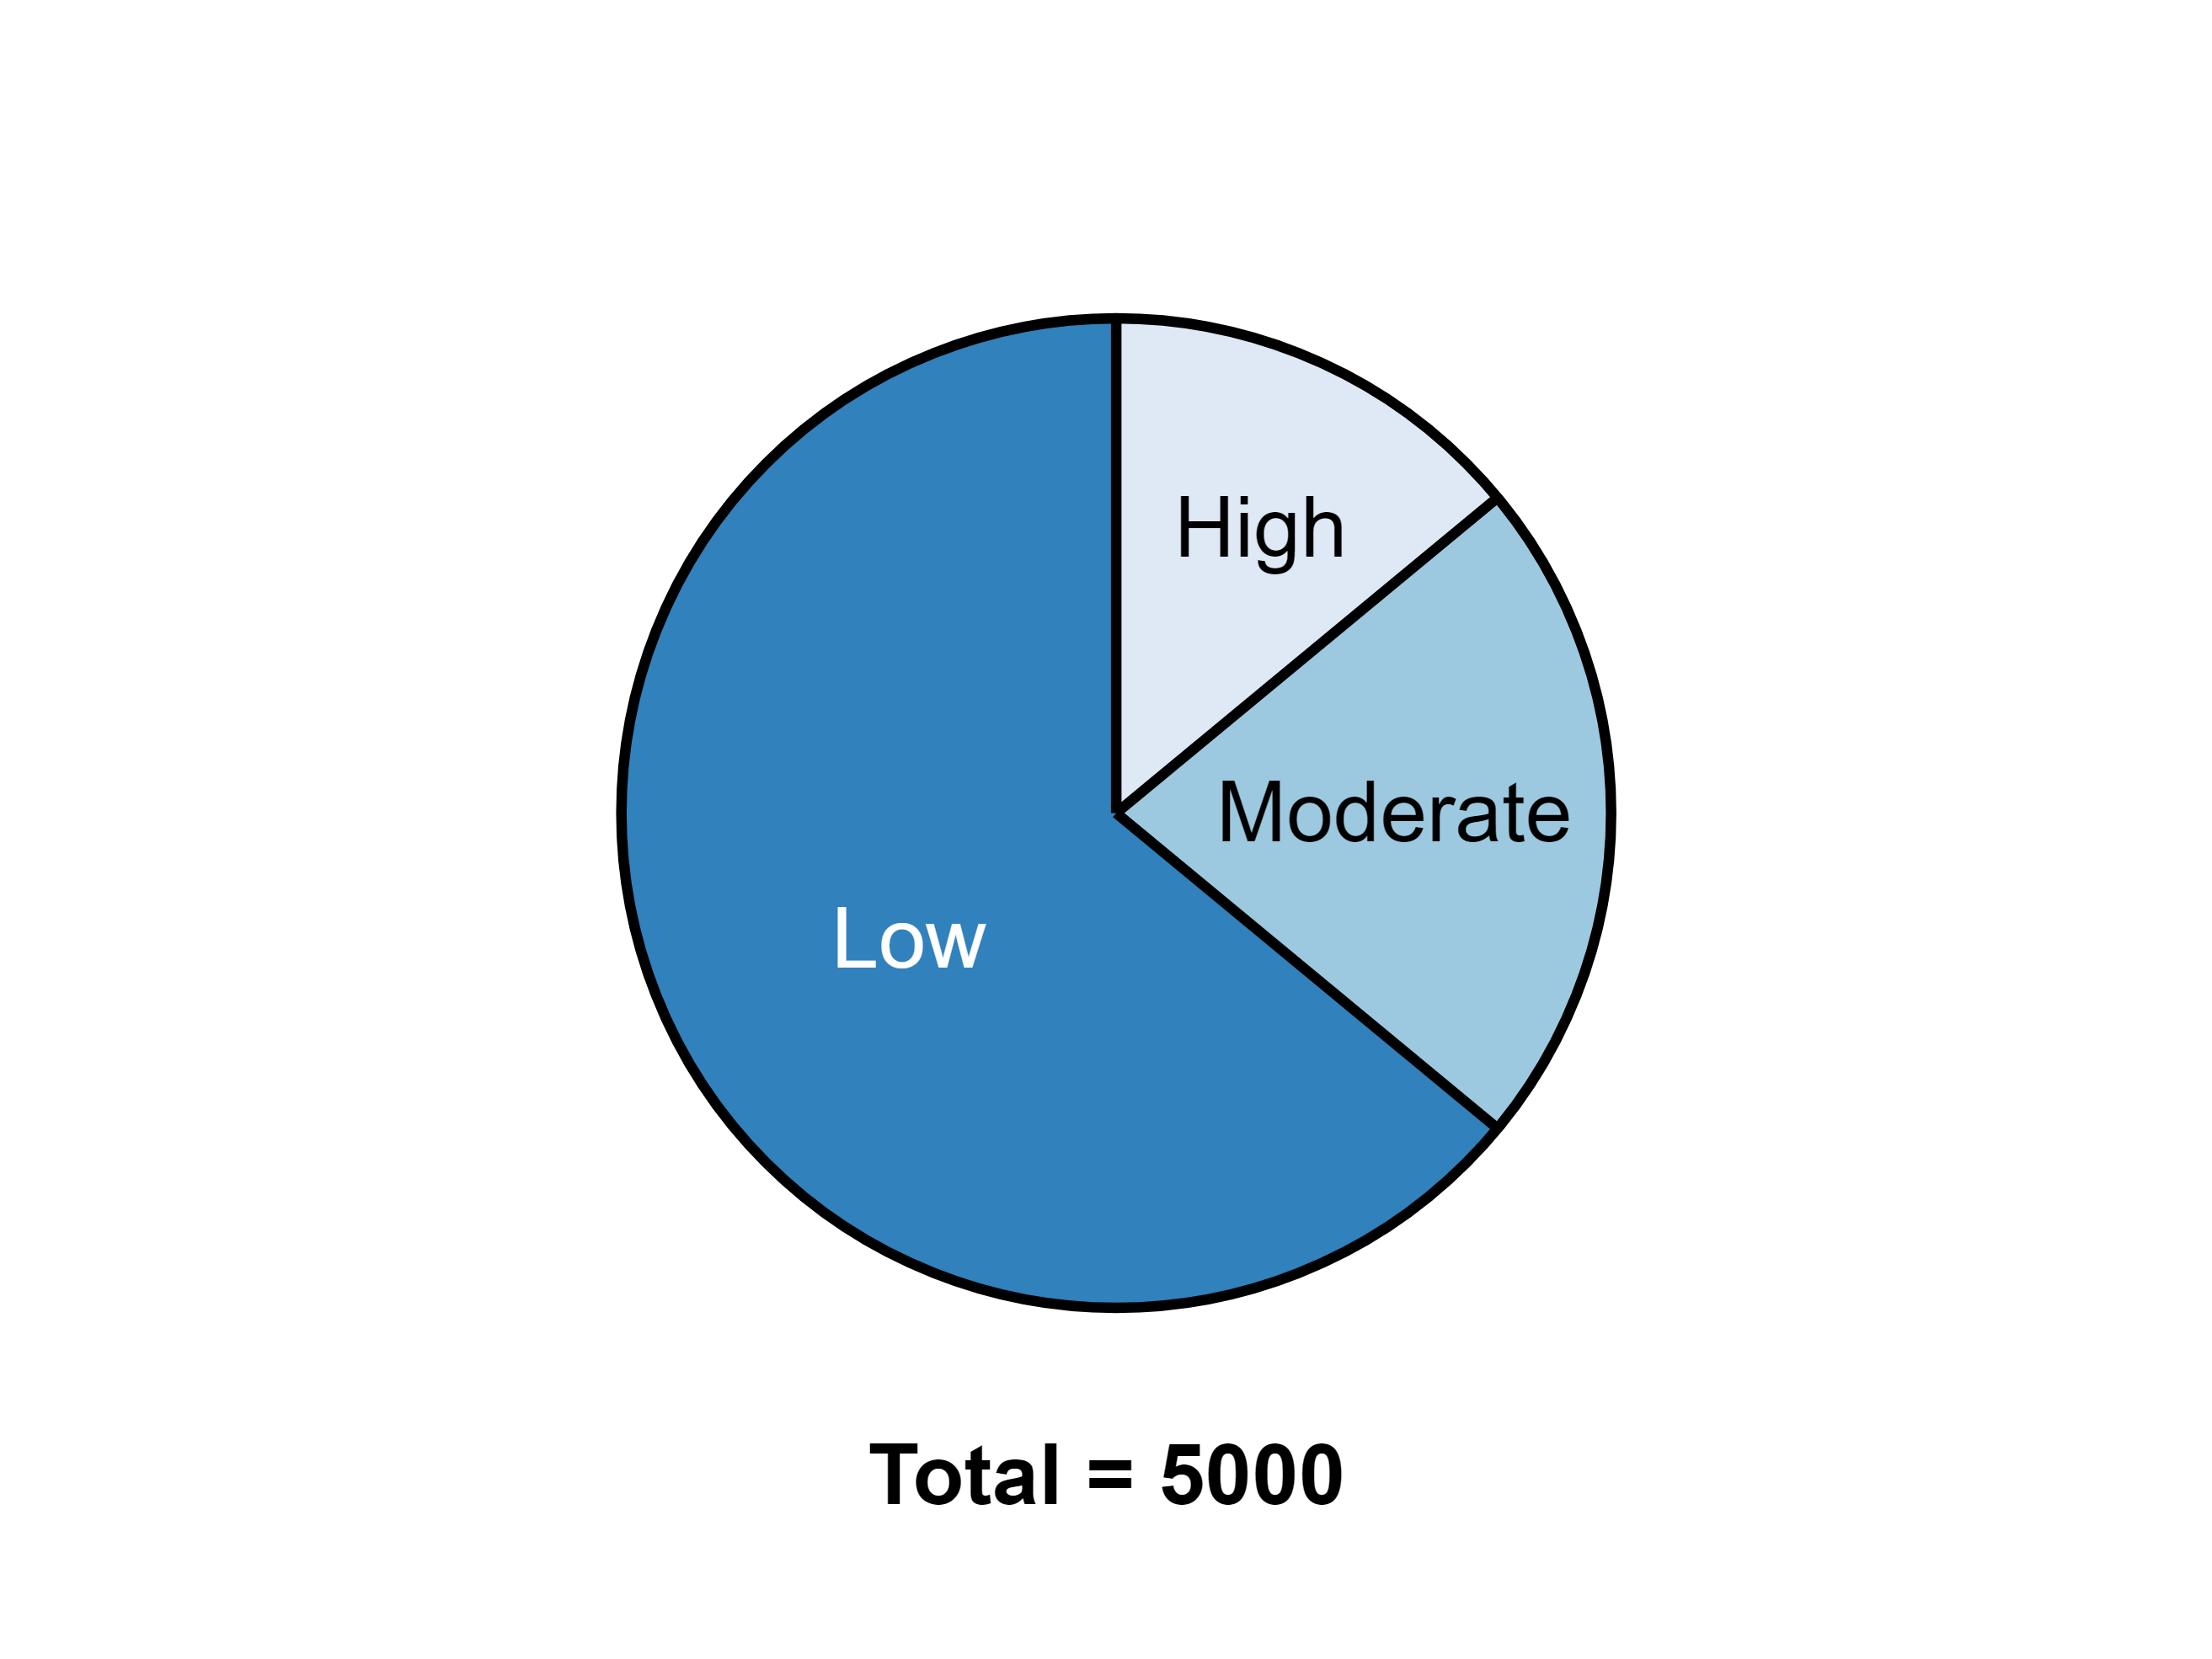
Synthetic infiltrating CD8+ T-cell counts divided into low, moderate, and high clonal expansion. Direct slice labels and a total of 5,000 make the composition readable without a separate legend.

  • pie chart
  • composition
  • t cells
  • clonal expansion
  • immunology
  • proportions
  • total count
Open in PivoGraph Download .pivograph
Graph type
Pie
Data structure
1 data series · 3 rows · 1 subcolumns per series
CD8 T-Cell Clone Expansion — Pie
Pie

About this example

Synthetic infiltrating CD8+ T-cell counts divided into low, moderate, and high clonal expansion. Direct slice labels and a total of 5,000 make the composition readable without a separate legend.

This project demonstrates a plotting workflow with synthetic data. The relationships visible in the figure are not research findings.

Design and analysis

Graph type
Pie
Analyses in this project

No statistical analysis is stored in this project.

Data and reuse

Data structure
1 data series · 3 rows · 1 subcolumns per series
Replace with your data
Replace the part labels and non-negative values in Data View. The figure recalculates each part's share of the selected total.

Data source
Synthetic data generated for this example
License
CC0-1.0

Related editable examples

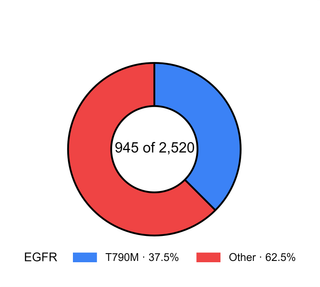
EGFR T790M Resistance Mechanisms — Donut

EGFR T790M Resistance Mechanisms

Donut

Edit a copy →
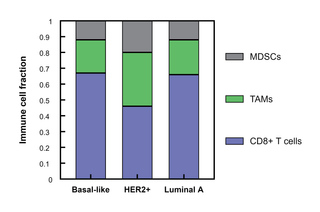
Tumor Microenvironment across Breast Cancer Subtypes — Stacked bars · Mean ± SD

Tumor Microenvironment across Breast Cancer Subtypes

Stacked bars · Mean ± SD

Edit a copy →
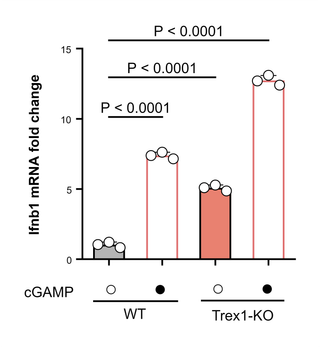
Ifnb1 Induction by Genotype and cGAMP — Column bar graph · Mean ± SD

Ifnb1 Induction by Genotype and cGAMP

Column bar graph · Mean ± SD

Edit a copy →
Privacy Terms Examples Updates Validation About
Language
  • English
  • 中文

© 2026 PivoGraph. All rights reserved.