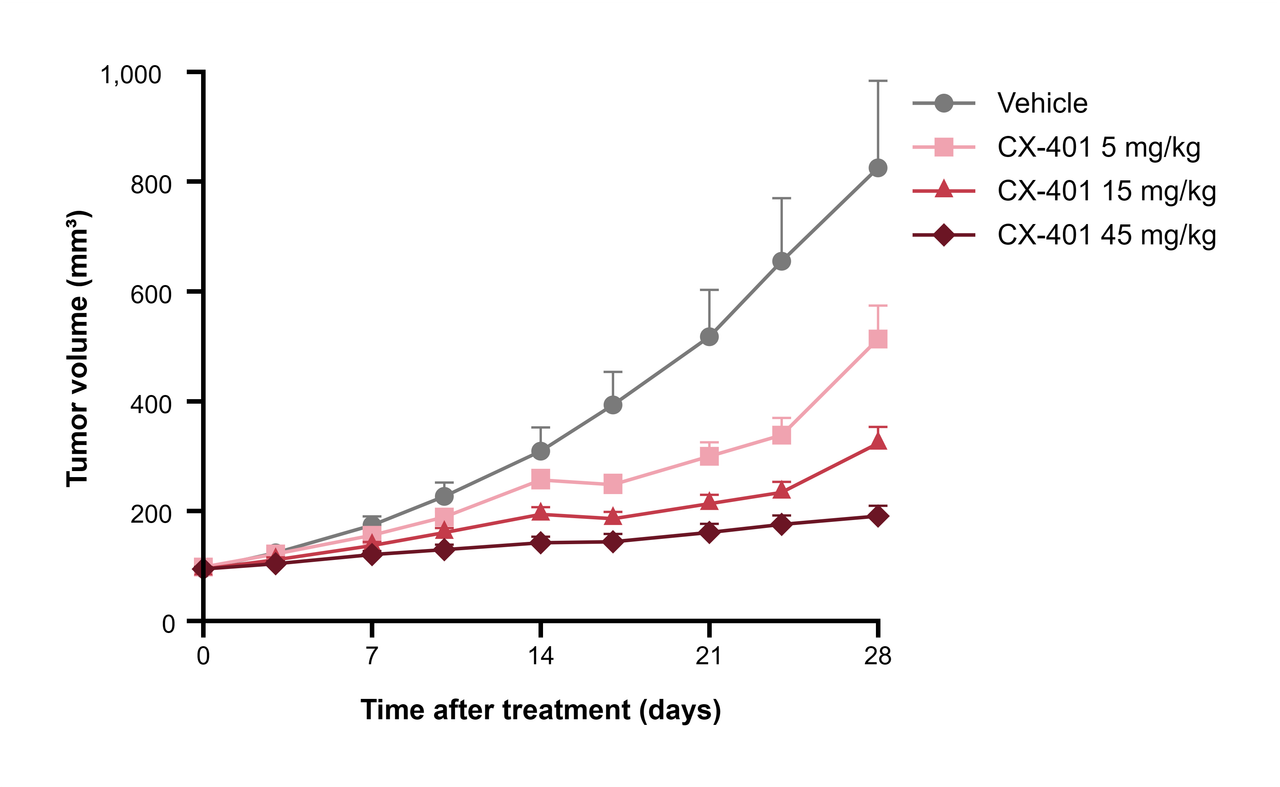
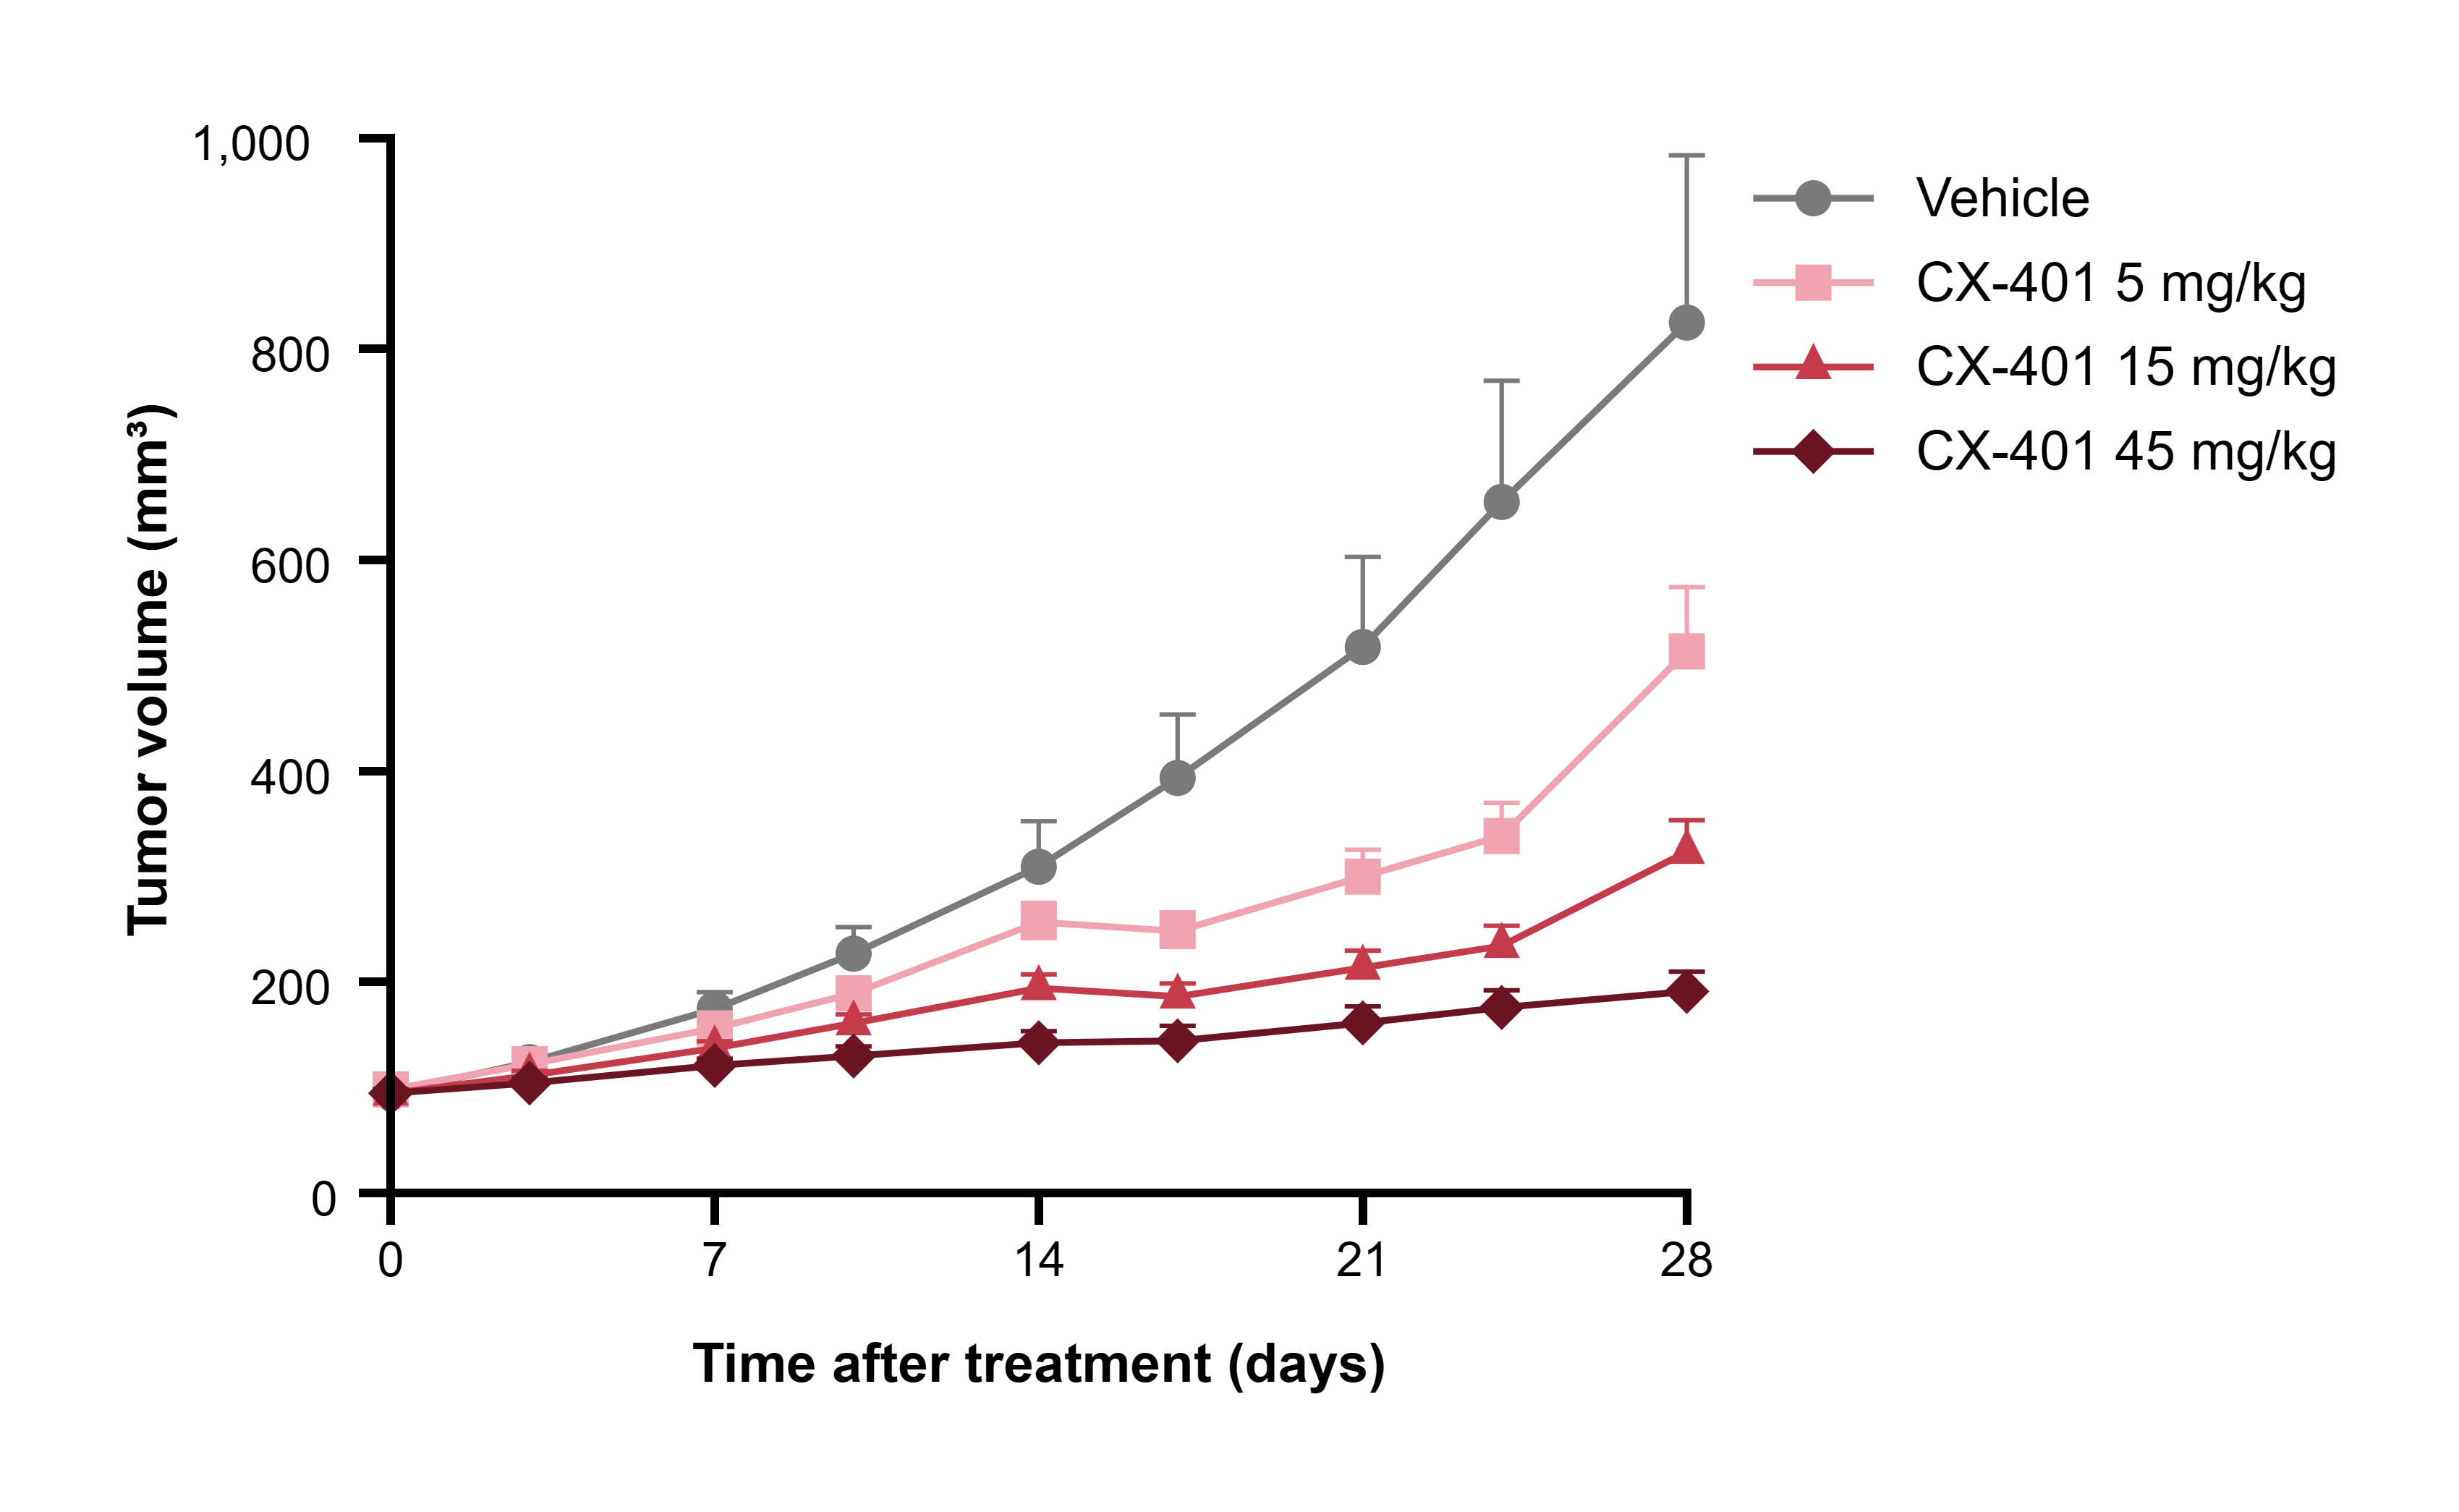
Synthetic mouse xenograft volume measured over 28 treatment days for vehicle and three CX-401 dose groups. Connected points show mean ± SEM and make the dose-dependent trajectories easy to compare.
Synthetic mouse xenograft volume measured over 28 treatment days for vehicle and three CX-401 dose groups. Connected points show mean ± SEM and make the dose-dependent trajectories easy to compare.
This project demonstrates a plotting workflow with synthetic data. The relationships visible in the figure are not research findings.
Design and analysis
Graph type
Points & line with error bars
Summary and uncertainty
Mean ± SEM
Analyses in this project
No statistical analysis is stored in this project.
Data and reuse
Data structure
4 data series · 9 rows · 6 subcolumns per series
Replace with your data
Replace the X values and each series of Y values in Data View. Keep the replicate subcolumns if you want the same summary and error-bar calculation; fitted analyses update from the new values.