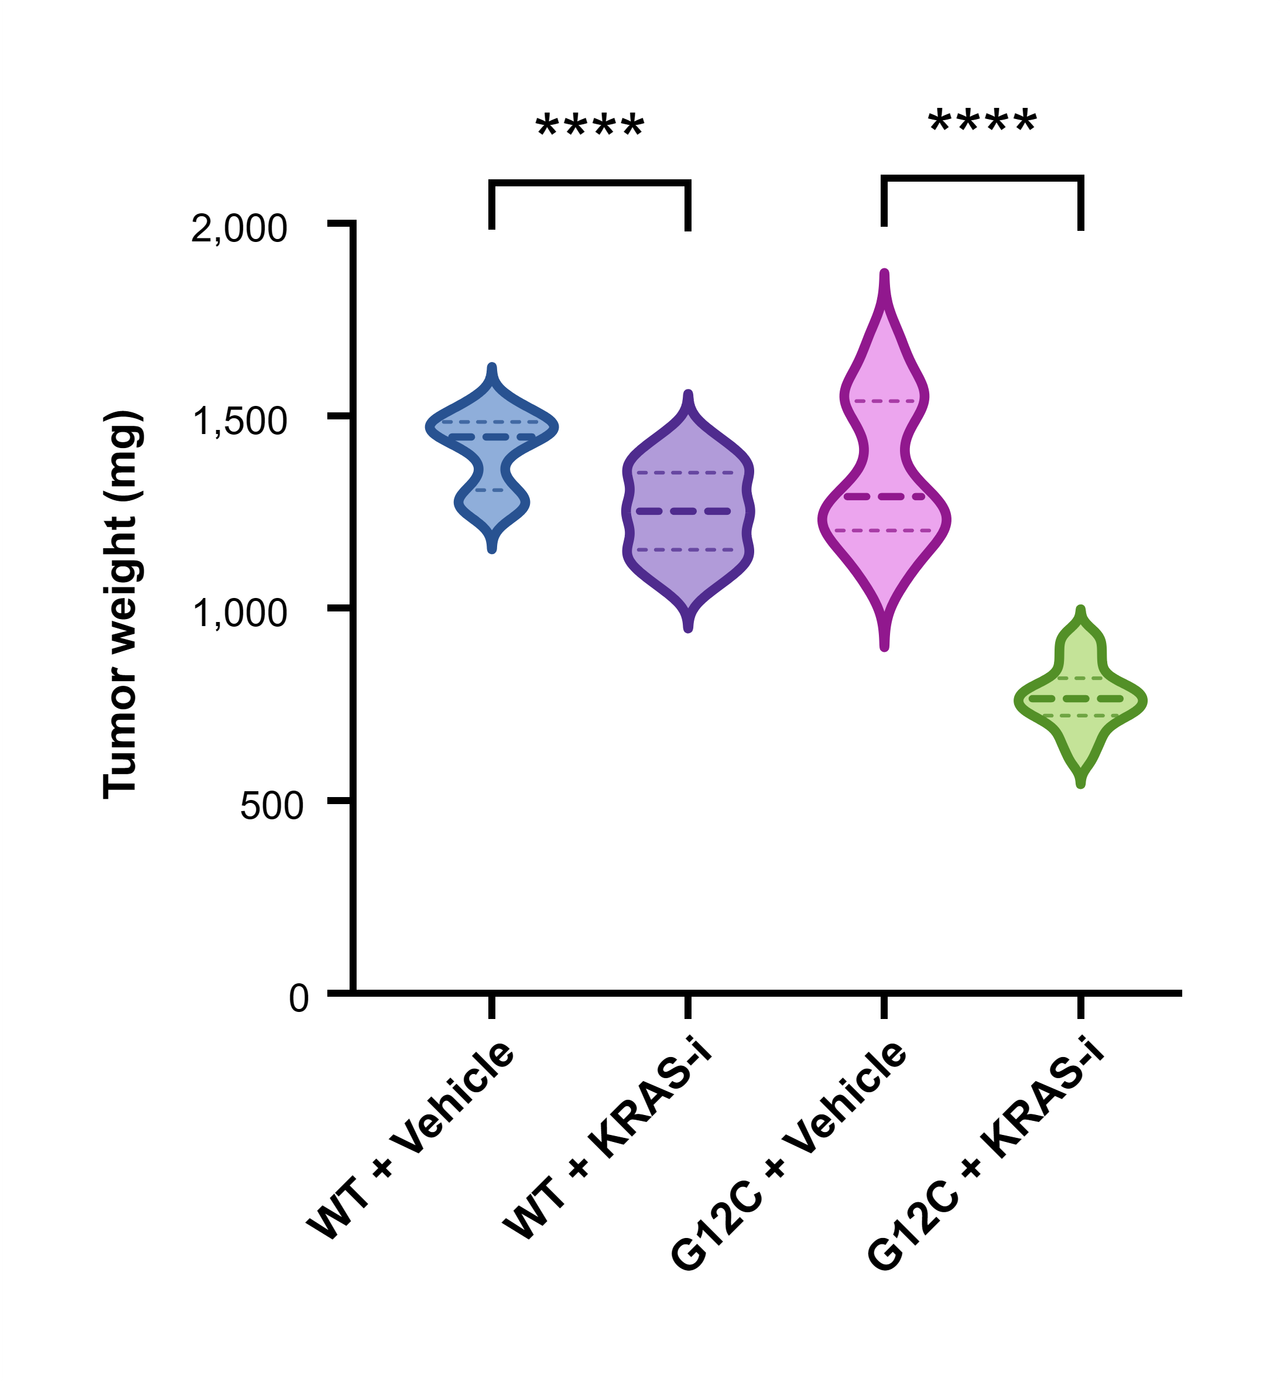
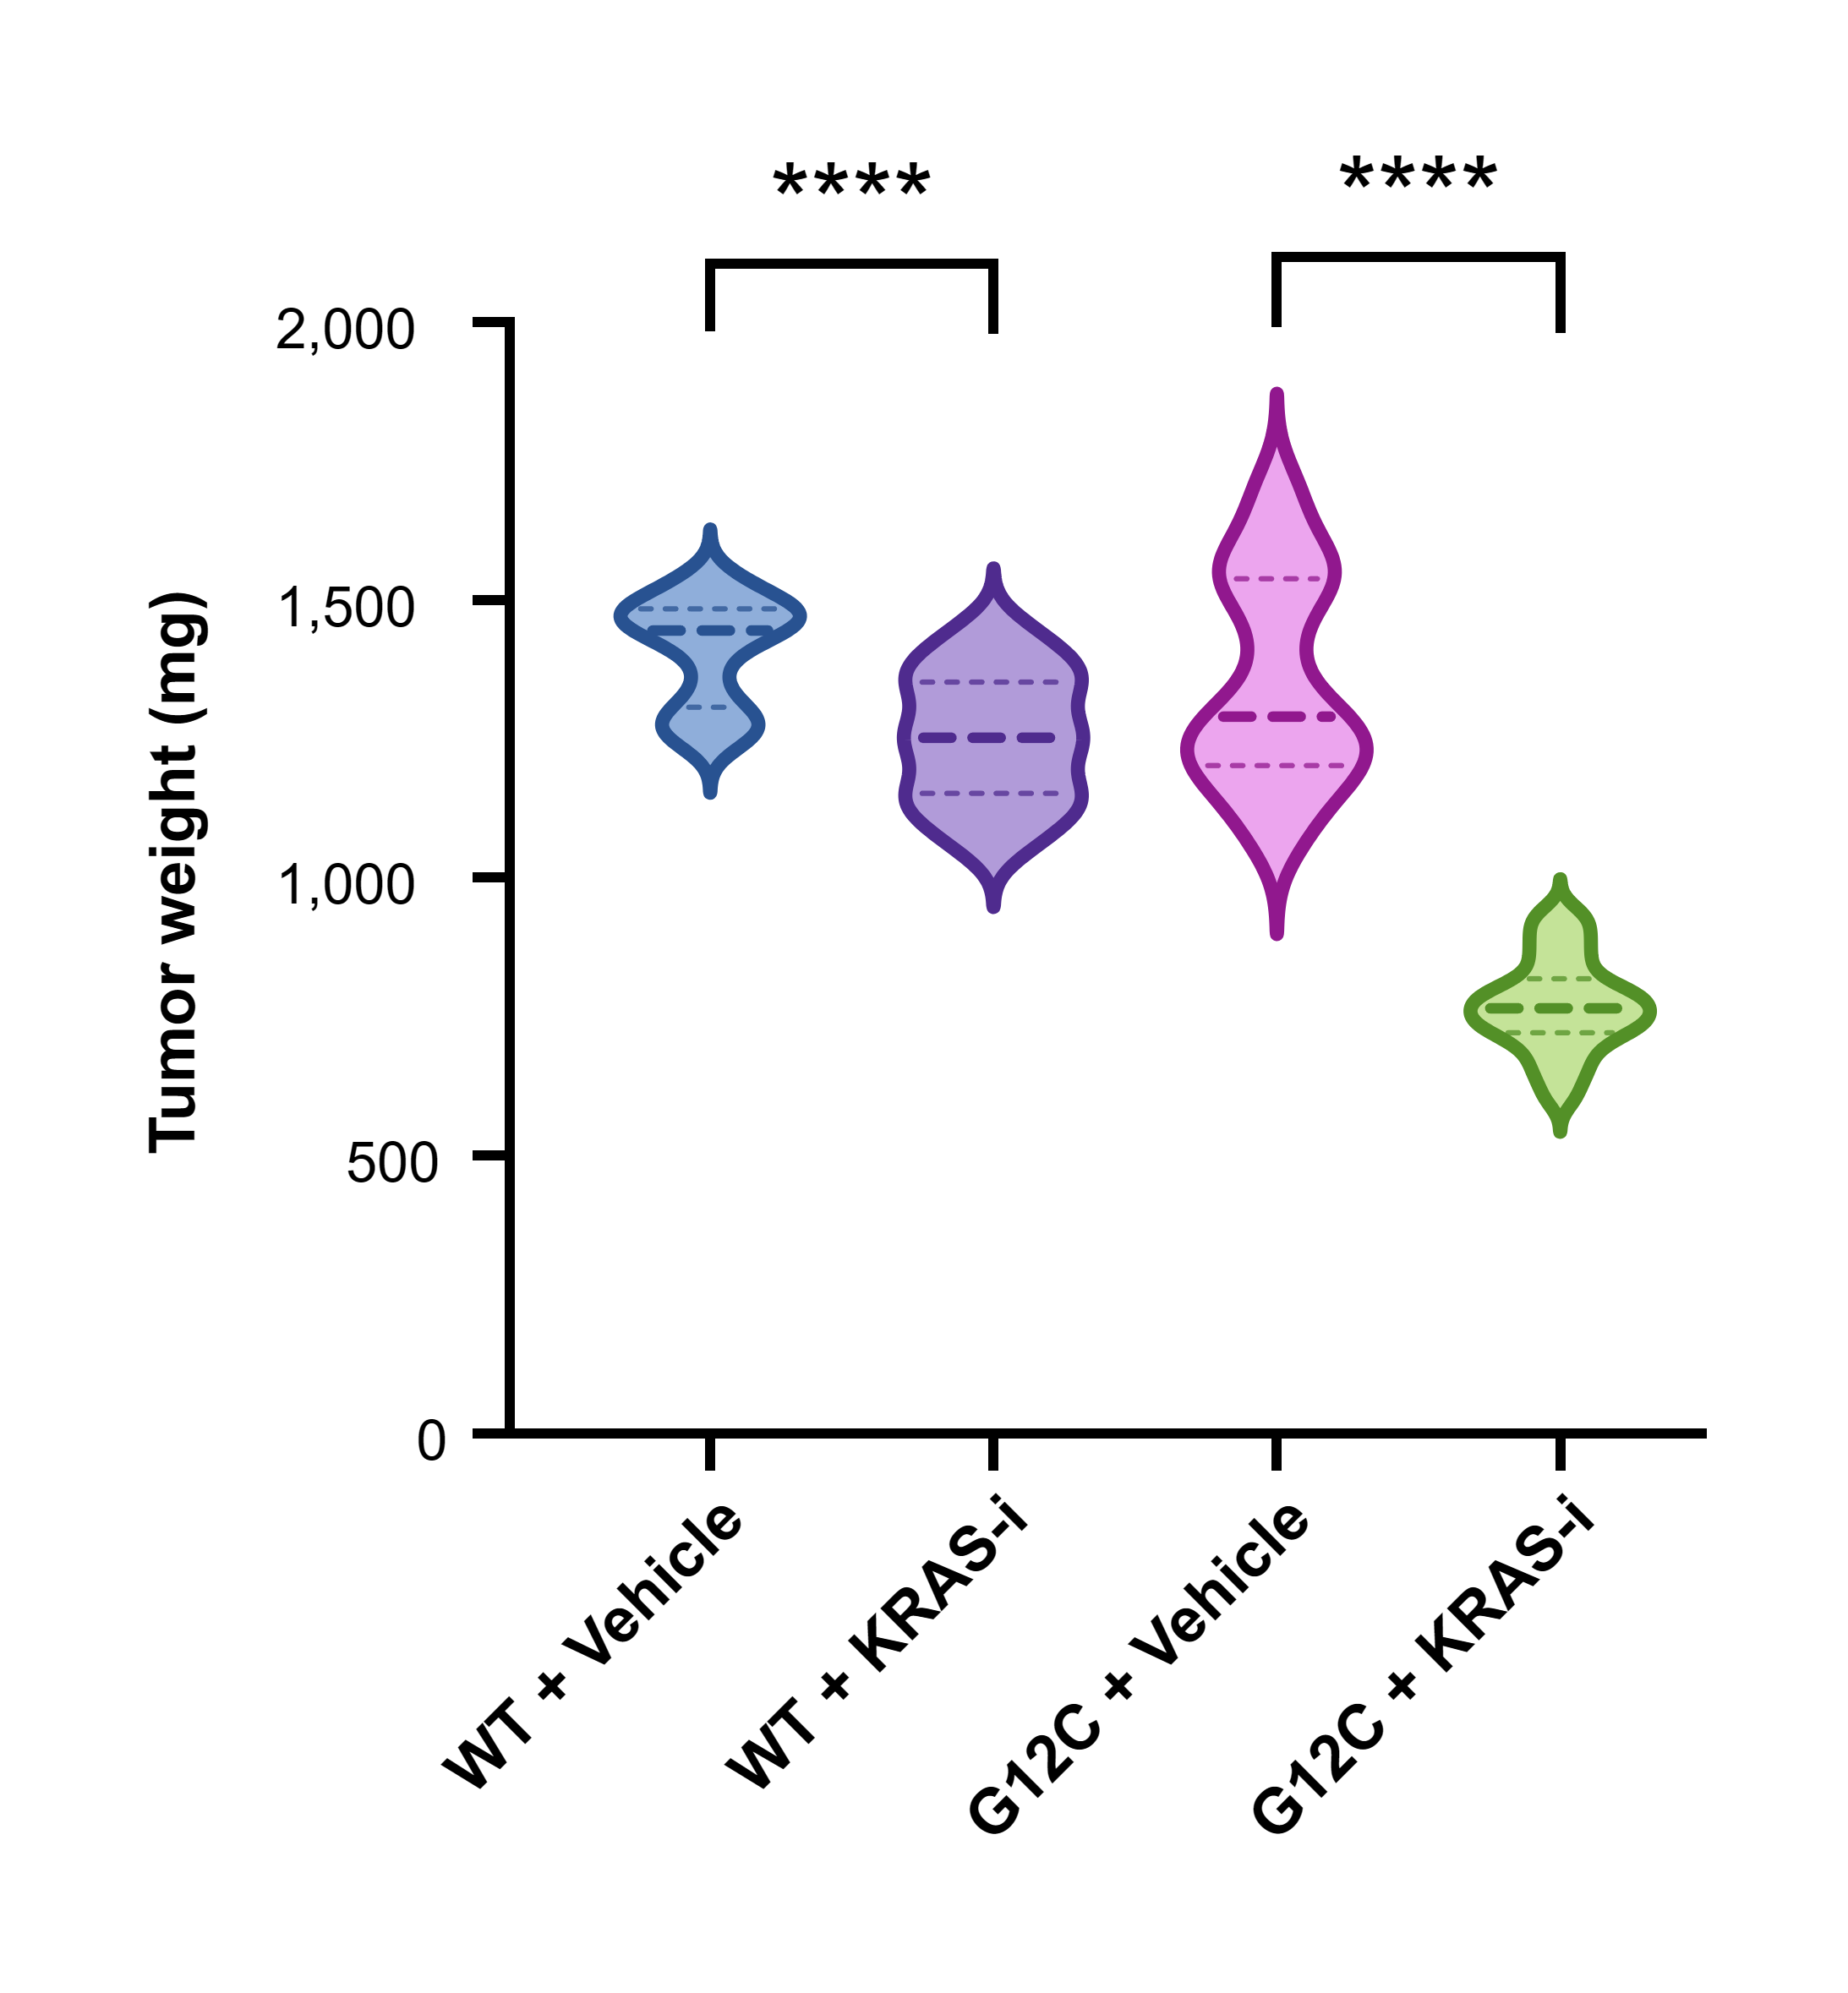
Endpoint tumor-weight distributions for synthetic KRAS wild-type and G12C PDX groups under vehicle or KRAS-inhibitor treatment. Violin shapes include median and quartile lines; both genotype-specific comparisons use Welch's unpaired t-test.
Endpoint tumor-weight distributions for synthetic KRAS wild-type and G12C PDX groups under vehicle or KRAS-inhibitor treatment. Violin shapes include median and quartile lines; both genotype-specific comparisons use Welch's unpaired t-test.
This project demonstrates a plotting workflow with synthetic data. The relationships visible in the figure are not research findings.
Design and analysis
Graph type
Violin plot
Analyses in this project
t-test (two groups)
Data and reuse
Data structure
4 data series · 35 rows · 1 subcolumns per series
Replace with your data
Replace the values in each independent group in Data View. Keep or rename the groups as needed; summaries, comparisons, and annotations can then be recalculated from your data.