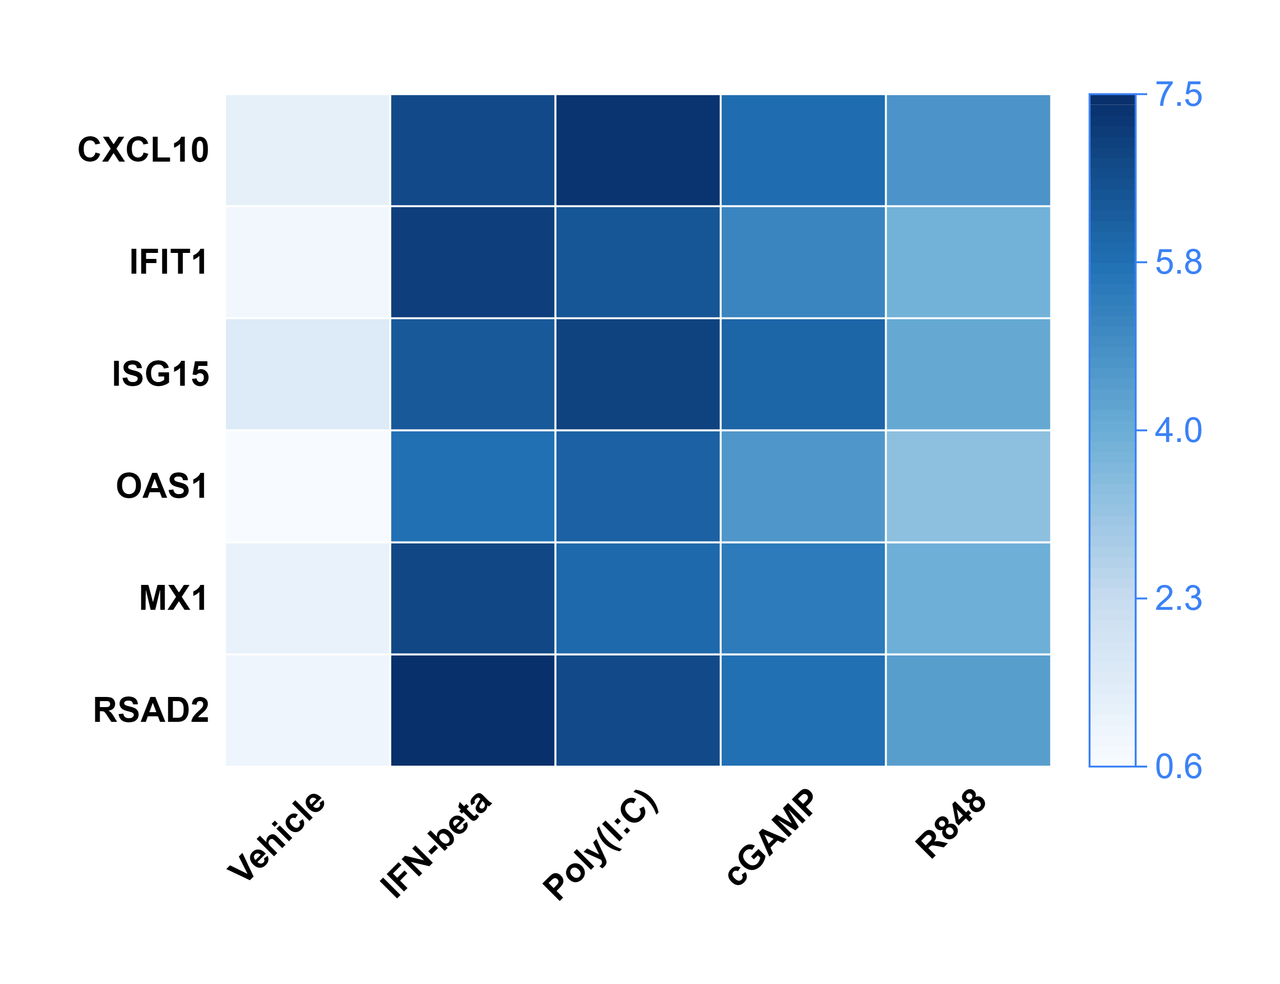
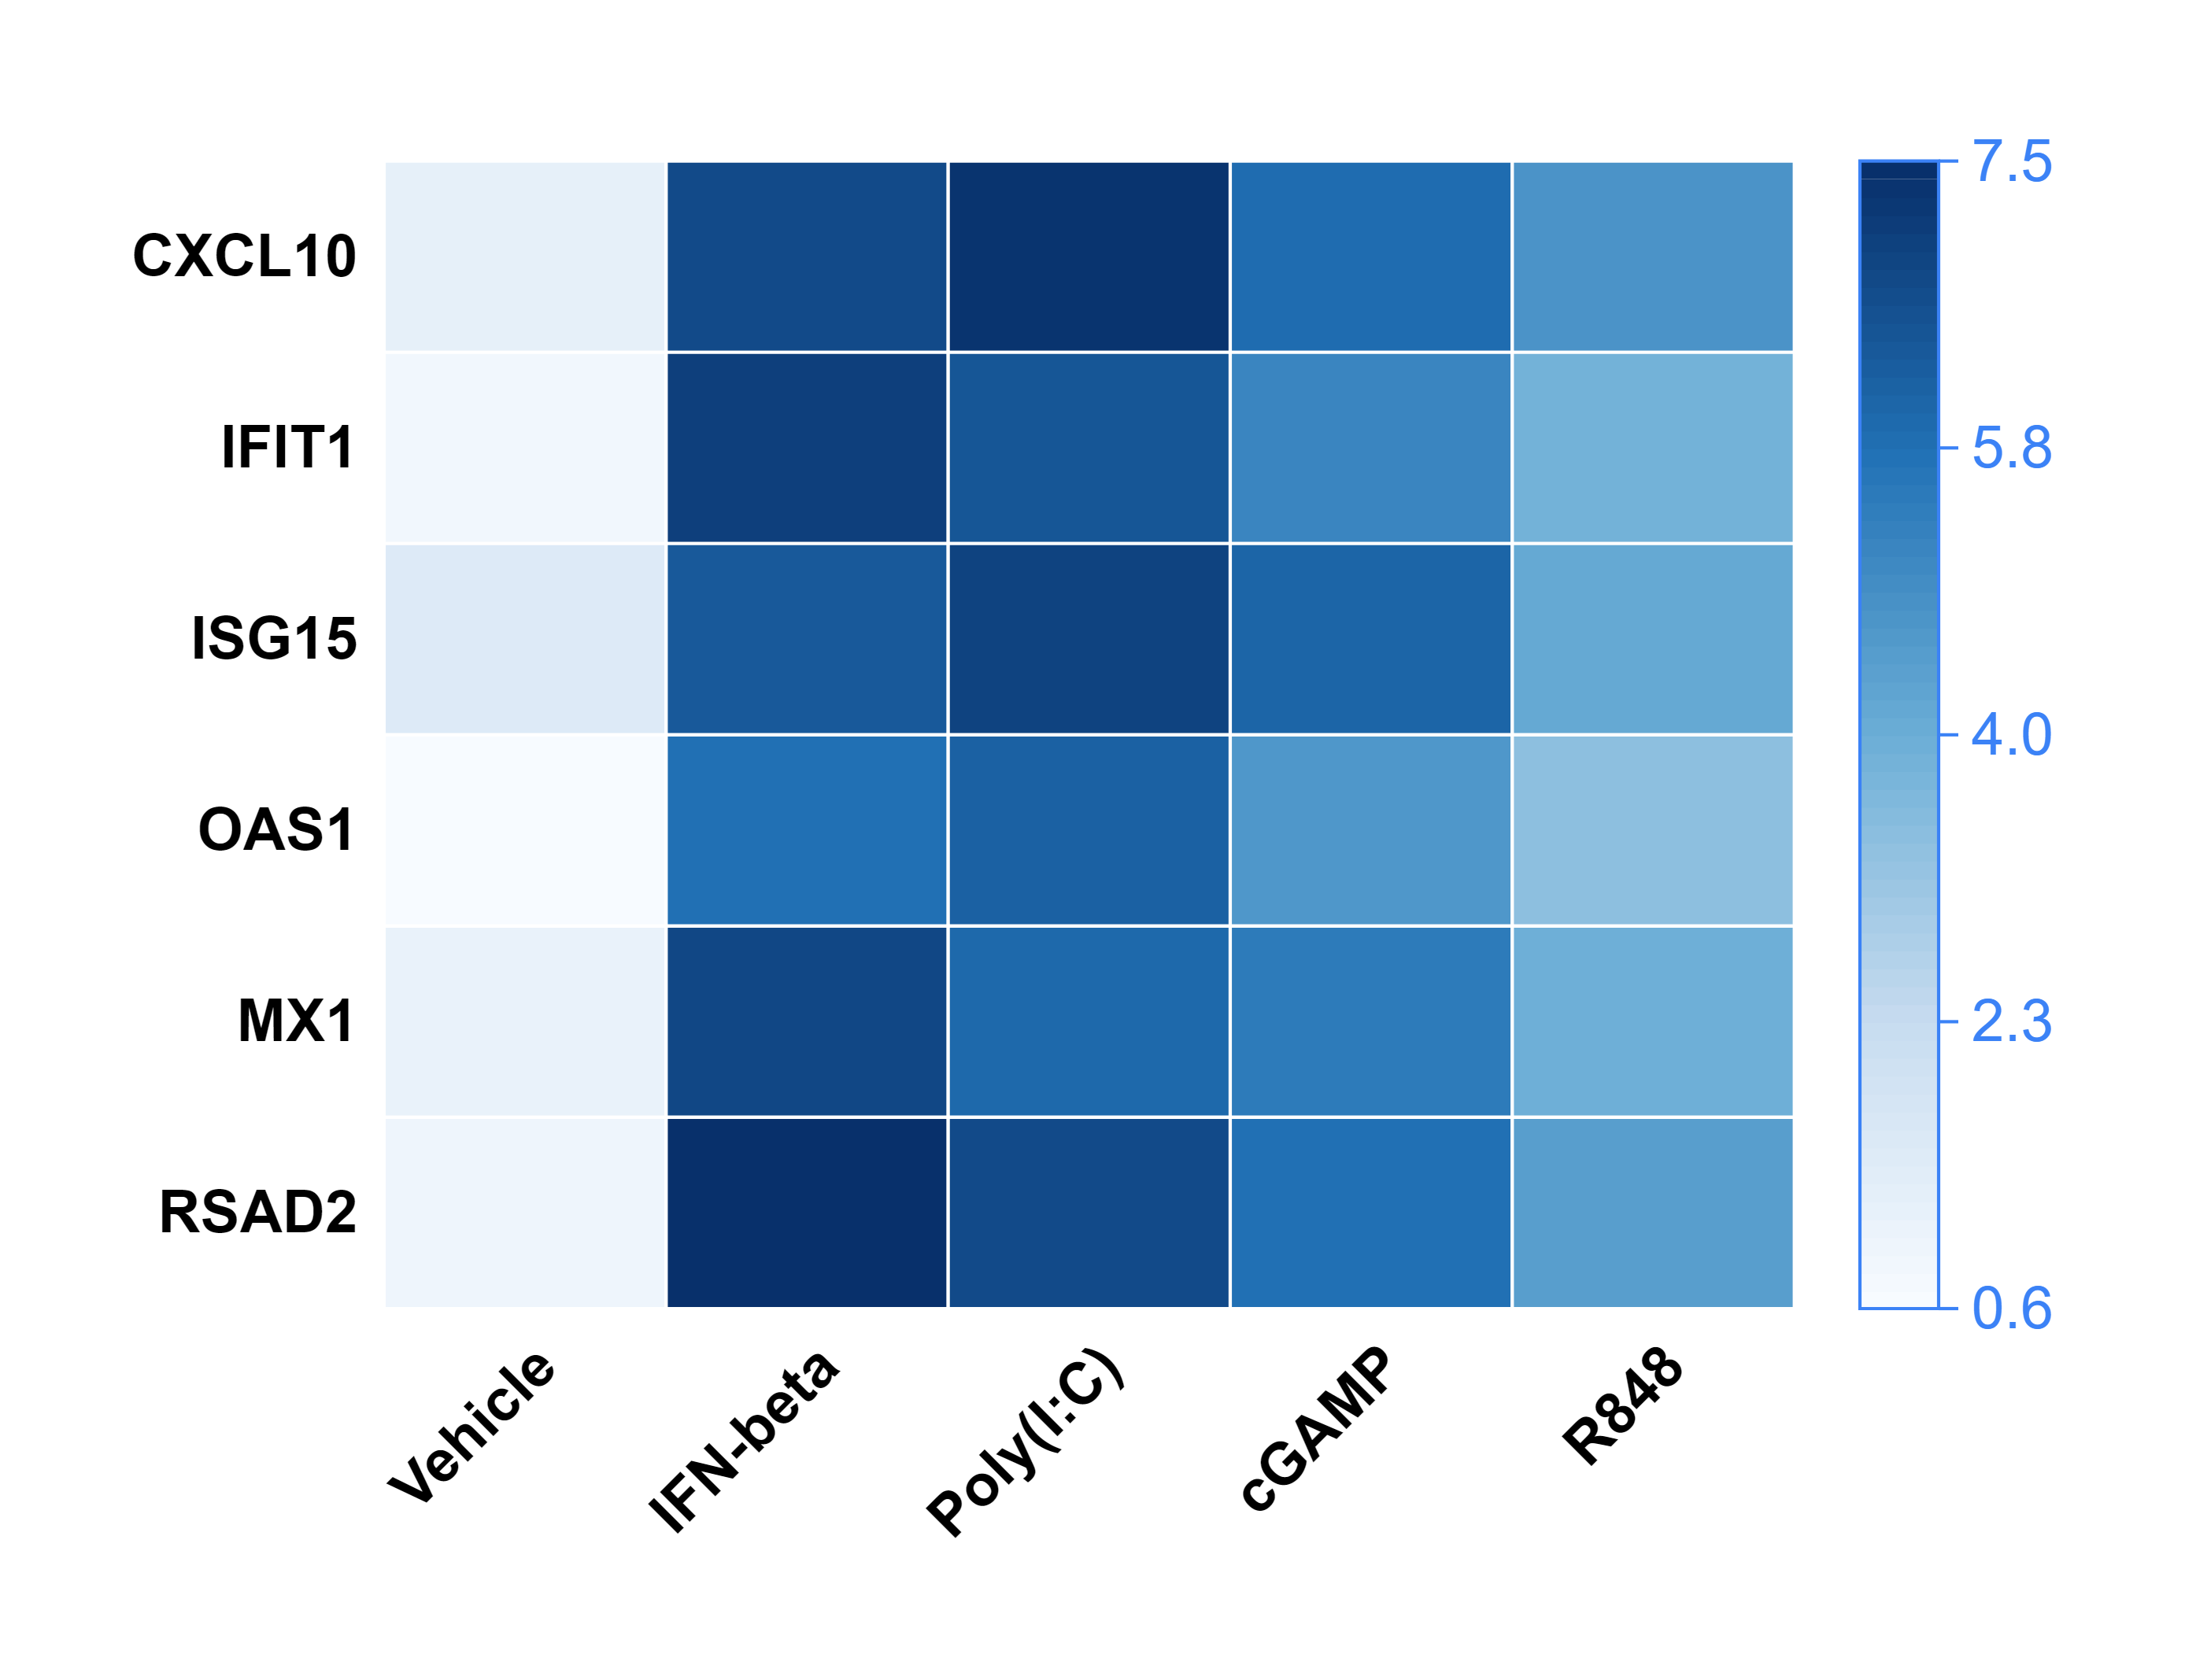
Relative expression of six interferon-stimulated genes across vehicle and four synthetic stimulation conditions. A sequential blue scale encodes the example log2-scale values without clustering.
Relative expression of six interferon-stimulated genes across vehicle and four synthetic stimulation conditions. A sequential blue scale encodes the example log2-scale values without clustering.
This project demonstrates a plotting workflow with synthetic data. The relationships visible in the figure are not research findings.
Design and analysis
Graph type
Heat map
Summary and uncertainty
Sequential color scale
Analyses in this project
No statistical analysis is stored in this project.
Data and reuse
Data structure
5 data series · 6 rows · 1 subcolumns per series
Replace with your data
Replace the row categories and values for each data series in Data View. Preserve the subcolumn layout when your measurements include replicates.